DIRECTV 2010 Annual Report Download - page 69
Download and view the complete annual report
Please find page 69 of the 2010 DIRECTV annual report below. You can navigate through the pages in the report by either clicking on the pages listed below, or by using the keyword search tool below to find specific information within the annual report.-
 1
1 -
2
-
3
-
4
-
5
-
6
-
7
-
8
-
9
-
10
-
11
-
12
-
13
-
14
-
15
-
16
-
17
-
18
-
19
-
20
-
21
-
22
-
23
-
24
-
25
-
26
-
27
-
28
-
29
-
30
-
31
-
32
-
33
-
34
-
35
-
36
-
37
-
38
-
39
-
40
-
41
-
42
-
43
-
44
-
45
-
46
-
47
-
48
-
49
-
50
-
51
-
52
-
53
-
54
-
55
-
56
-
57
-
58
-
 59
59 -
 60
60 -
 61
61 -
 62
62 -
 63
63 -
 64
64 -
 65
65 -
 66
66 -
 67
67 -
 68
68 -
 69
69 -
 70
70 -
 71
71 -
 72
72 -
 73
73 -
 74
74 -
 75
75 -
 76
76 -
 77
77 -
 78
78 -
 79
79 -
80
-
81
-
82
-
83
-
84
-
85
-
86
-
87
-
88
-
89
-
90
-
91
-
92
-
93
-
94
-
95
-
96
-
97
-
98
-
99
-
100
-
101
-
102
-
103
-
104
-
105
-
106
-
107
-
108
-
109
-
110
-
111
-
112
-
113
-
114
-
115
-
116
-
117
-
118
-
119
-
120
-
121
-
122
-
123
-
124
-
125
-
126
-
127
-
128
-
129
-
130
-
131
-
132
-
133
-
134
-
135
-
136
-
137
-
138
-
139
-
140
-
141
-
142
 |
 |

DIRECTV
approximately 19,000 subscribers from DIRECTV Latin America to Sky LIQUIDITY AND CAPITAL RESOURCES
Mexico during 2008. Additionally, we migrated approximately 16,000 Our principal sources of liquidity are our cash, cash equivalents and the cash
subscribers from a local pay television service provider in Latin America to Sky flow that we generate from our operations. Additionally, from 2008 to 2010 we
Brazil during 2009. Net subscriber additions as well as churn exclude the completed multiple financing transactions that have resulted in approximately
effect of these migrations. $10.5 billion of net cash proceeds. We have also experienced significant growth in
The increase in net subscriber additions was due to strong subscriber demand net cash provided by operating activities and free cash flow. We expect that net cash
across the region, particularly in Colombia, Brazil and Puerto Rico, increased provided by operating activities will continue to grow and believe that our existing
demand for DVR, HD and pre-paid services, as well as targeted customer cash balances and cash provided by operations will be sufficient to fund our existing
promotions. The decrease in average monthly subscriber churn was primarily due to business plan. Additionally, in February 2011, DIRECTV U.S. entered into a new
two downward subscriber adjustments in 2008 totaling 78,000 subscribers. $2 billion revolving credit facility, which is available until 2016. We may borrow
Excluding these subscriber adjustments, churn would have increased 17 basis points under this facility to fund share repurchases or to fund strategic investment
principally due to the growth of DTVLA’s prepaid business. opportunities should they arise.
Revenues increased in 2009 primarily due to strong subscriber and ARPU At December 31, 2010, our cash and cash equivalents totaled $1.5 billion
growth. ARPU increased mainly due to price increases in Venezuela, Brazil and compared with $2.6 billion at December 31, 2009.
Argentina, as well as higher fees for HD and DVR services, partially offset by As a measure of liquidity, the current ratio (ratio of current assets to current
foreign currency devaluations, particularly in Brazil and Argentina. liabilities) was 0.96 at December 31, 2010 and 0.89 at December 31, 2009.
The higher operating profit before depreciation and amortization is primarily Working capital improved by $449 million to a $197 million deficit at
due to the gross profit generated from the higher revenues, partially offset by higher December 31, 2010 from a deficit of $646 million at December 31, 2009. The
general and administrative expense due primarily to $213 million in currency improvement during the period was mostly due to the decrease in our current debt
related transaction fees in Venezuela, an increase in subscriber acquisition costs balance due to the repayment of debt and the related equity collars as part of the
mostly due to an increase in gross subscriber additions and higher subscriber service Liberty Transaction.
costs primarily related to customer service improvement initiatives and the larger
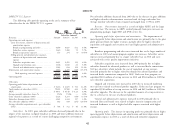
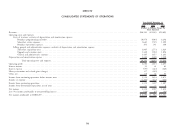
subscriber base. Summary Cash Flow Information
The lower operating profit was primarily due to the increase in operating Years Ended December 31,
profit before depreciation and amortization, offset by higher depreciation and 2010 2009 2008
amortization expense primarily due to an increase in basic and advance product (Dollars in Millions)
receivers leased over the last year. Net cash provided by operating activities ....... $5,206 $ 4,431 $ 3,910
Net cash used in investing activities ........... (3,099) (2,194) (2,388)
Sports Networks, Eliminations and Other Net cash used in financing activities ........... (3,210) (1,637) (600)
Free cash flow:
Operating loss from Sports Networks, Elimination and Other increased to Net cash provided by operating activities ....... $5,206 $ 4,431 $ 3,910
$68 million in 2009 from $61 million in 2008. Sports Networks, Eliminations and Less: Cash paid for property, equipment and
Other primarily consisted of corporate operating costs until November 19, 2009 satellites ........................... (2,416) (2,071) (2,229)
when we completed the Liberty Transaction and acquired the RSNs.
Free cash flow ......................... $2,790 $ 2,360 $ 1,681
47