DIRECTV 2010 Annual Report Download - page 102
Download and view the complete annual report
Please find page 102 of the 2010 DIRECTV annual report below. You can navigate through the pages in the report by either clicking on the pages listed below, or by using the keyword search tool below to find specific information within the annual report.-
 1
1 -
2
-
3
-
4
-
5
-
6
-
7
-
8
-
9
-
10
-
11
-
12
-
13
-
14
-
15
-
16
-
17
-
18
-
19
-
20
-
21
-
22
-
23
-
24
-
25
-
26
-
27
-
28
-
29
-
30
-
31
-
32
-
33
-
34
-
35
-
36
-
37
-
38
-
39
-
40
-
41
-
42
-
43
-
44
-
45
-
46
-
47
-
48
-
49
-
50
-
51
-
52
-
53
-
54
-
55
-
56
-
57
-
58
-
59
-
60
-
61
-
62
-
63
-
64
-
65
-
66
-
67
-
68
-
69
-
70
-
71
-
72
-
73
-
74
-
75
-
76
-
77
-
78
-
79
-
80
-
81
-
82
-
83
-
84
-
85
-
86
-
87
-
88
-
89
-
90
-
91
-
 92
92 -
 93
93 -
 94
94 -
 95
95 -
 96
96 -
 97
97 -
 98
98 -
 99
99 -
 100
100 -
 101
101 -
 102
102 -
 103
103 -
 104
104 -
 105
105 -
 106
106 -
 107
107 -
 108
108 -
 109
109 -
 110
110 -
 111
111 -
 112
112 -
113
-
114
-
115
-
116
-
117
-
118
-
119
-
120
-
121
-
122
-
123
-
124
-
125
-
126
-
127
-
128
-
129
-
130
-
131
-
132
-
133
-
134
-
135
-
136
-
137
-
138
-
139
-
140
-
141
-
142
 |
 |

DIRECTV
NOTES TO THE CONSOLIDATED FINANCIAL STATEMENTS—(continued)
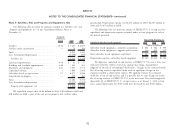
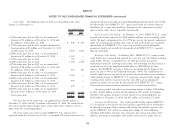
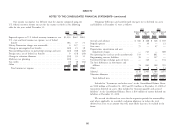
Our income tax expense was different than the amount computed using the Temporary differences and carryforwards that gave rise to deferred tax assets
U.S. federal statutory income tax rate for the reasons set forth in the following and liabilities at December 31 were as follows:
table for the years ended December 31: 2010 2009
2010 2009 2008 Deferred Deferred Deferred Deferred
Tax Tax Tax Tax
(Dollars in Millions) Assets Liabilities Assets Liabilities
Expected expense at U.S. federal statutory income tax rate $1,230 $642 $865 (Dollars in Millions)
U.S. state and local income tax expense, net of federal Accruals and advances ................. $ 366 $ 168 $ 328 $ 103
benefit ................................ 106 77 73 Prepaid expenses .................... — 39 — 21
Liberty Transaction charges not recoverable .......... 4 127 — State taxes ........................ 75 — 57 —
Change in unrecognized tax benefits .............. (40) 21 18 Depreciation, amortization and asset
Noncontrolling interests in partnership earnings and taxes (44) (30) (43) impairment charges ................. — 723 — 608
Foreign taxes, net of federal tax benefits ............ 9 (31) (33) Net operating loss and tax credit carryforwards 533 — 881 —
Change in valuation allowance .................. (32) 33 11 Programming contract liabilities .......... 59 — 127 —
Multistate tax planning ....................... (20) — — Unrealized foreign exchange gains or losses . . . — 146 — 134
Tax credits ............................... (7) (3) (32) Tax basis differences in investments and
Other ................................... (4) (9) 5 affiliates ........................ 74 861 188 795
Total income tax expense .................... $1,202 $827 $864 Other ........................... 11 8 5 14
Subtotal .......................... 1,118 1,945 1,586 1,675
Valuation allowance .................. (504) — (711) —
Total deferred taxes ................. $ 614 $1,945 $ 875 $1,675
Included in ‘‘Investments and other assets’’ in the Consolidated Balance Sheets
are $320 million at December 31, 2010 and $53 million at December 31, 2009 of
noncurrent deferred tax assets. Also included in ‘‘Accounts payable and accrued
liabilities’’ in the Consolidated Balance Sheets is $34 million of current deferred tax
liabilities at December 31, 2010.
We assessed the deferred tax assets for the respective periods for recoverability
and, where applicable, we recorded a valuation allowance to reduce the total
deferred tax assets to an amount that will, more likely than not, be realized in the
future.
80