DIRECTV 2010 Annual Report Download - page 64
Download and view the complete annual report
Please find page 64 of the 2010 DIRECTV annual report below. You can navigate through the pages in the report by either clicking on the pages listed below, or by using the keyword search tool below to find specific information within the annual report.-
 1
1 -
2
-
3
-
4
-
5
-
6
-
7
-
8
-
9
-
10
-
11
-
12
-
13
-
14
-
15
-
16
-
17
-
18
-
19
-
20
-
21
-
22
-
23
-
24
-
25
-
26
-
27
-
28
-
29
-
30
-
31
-
32
-
33
-
34
-
35
-
36
-
37
-
38
-
39
-
40
-
41
-
42
-
43
-
44
-
45
-
46
-
47
-
48
-
49
-
50
-
51
-
52
-
53
-
 54
54 -
 55
55 -
 56
56 -
 57
57 -
 58
58 -
 59
59 -
 60
60 -
 61
61 -
 62
62 -
 63
63 -
 64
64 -
 65
65 -
 66
66 -
 67
67 -
 68
68 -
 69
69 -
 70
70 -
 71
71 -
 72
72 -
 73
73 -
 74
74 -
75
-
76
-
77
-
78
-
79
-
80
-
81
-
82
-
83
-
84
-
85
-
86
-
87
-
88
-
89
-
90
-
91
-
92
-
93
-
94
-
95
-
96
-
97
-
98
-
99
-
100
-
101
-
102
-
103
-
104
-
105
-
106
-
107
-
108
-
109
-
110
-
111
-
112
-
113
-
114
-
115
-
116
-
117
-
118
-
119
-
120
-
121
-
122
-
123
-
124
-
125
-
126
-
127
-
128
-
129
-
130
-
131
-
132
-
133
-
134
-
135
-
136
-
137
-
138
-
139
-
140
-
141
-
142
 |
 |

DIRECTV
DIRECTV U.S. Segment Net subscriber additions decreased from 2009 due to the decrease in gross additions
and higher subscriber disconnections associated with the larger subscriber base.
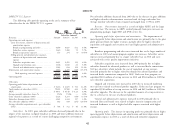
The following table provides operating results and a summary of key Average monthly subscriber churn remained unchanged from 1.53% in 2009.
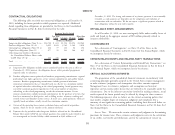
subscriber data for the DIRECTV U.S. segment:
Revenues. Our revenues increased as a result of higher ARPU and the larger
Change subscriber base. The increase in ARPU resulted primarily from price increases on
2010 2009 $ % programming packages, higher HD and DVR service fees.
(Dollars in Millions, Except Per
Subscriber Amounts) Operating profit before depreciation and amortization. The improvement of
Revenues ........................... $20,268 $18,671 $1,597 8.6% operating profit before depreciation and amortization was primarily due to the gross
Operating costs and expenses profit generated from the higher revenues, partially offset by higher subscriber
Costs of revenues, exclusive of depreciation and acquisition and upgrade and retention costs and higher general and administrative
amortization expense
expenses.
Broadcast programming and other ........ 8,699 8,027 672 8.4%
Subscriber service expenses ............ 1,340 1,268 72 5.7% Broadcast programming and other costs increased due to the larger number of
Broadcast operations expenses ........... 273 274 (1) (0.4)% subscribers in 2010 and annual program supplier rate increases. Subscriber service
Selling, general and administrative expenses, expenses increased primarily due to a larger subscriber base in 2010 and costs
exclusive of depreciation and amortization associated with service quality improvement initiatives.
expense
Subscriber acquisition costs ............ 2,631 2,478 153 6.2% Subscriber acquisition costs increased from 2009 primarily due to higher
Upgrade and retention costs ............ 1,106 1,045 61 5.8% subscriber demand for advanced products as well as increased dealer commissions.
General and administrative expenses ....... 1,003 894 109 12.2% SAC per subscriber, which includes the cost of capitalized set-top receivers,
Depreciation and amortization expense ........ 1,926 2,275 (349) (15.3)% increased primarily due to higher subscriber demand for advanced products and
Total operating costs and expenses ...... 16,978 16,261 717 4.4% increased dealer commissions compared to 2009. Under our lease program, we
Operating profit ...................... $3,290 $ 2,410 $ 880 36.5% capitalized $651 million of set-top receivers in 2010 and $564 million in 2009 for
new subscriber acquisitions.
Other data: Upgrade and retention costs increased in 2010 due to increased marketing
Operating profit before depreciation and
costs and costs related to advanced product upgrades. Under our lease program we
amortization ....................... $5,216 $ 4,685 $ 531 11.3%
Total number of subscribers (000’s) .......... 19,223 18,560 663 3.6% capitalized $316 million of set-top receivers in 2010 and $419 million in 2009 for
ARPU ............................ $89.71 $ 85.48 $ 4.23 4.9% subscriber upgrades. The decrease in the capitalized amount of set-top receivers is
Average monthly subscriber churn % ......... 1.53% 1.53% — 0.0% due to a decrease in the cost of advanced products.
Gross subscriber additions (000’s) ........... 4,124 4,273 (149) (3.5)% General and administrative expenses increased in 2010 primarily due to
Subscriber disconnections (000’s) ............ 3,461 3,334 127 3.8%
increased labor and benefit costs related to higher incentive compensation and
Net subscriber additions (000’s) ............ 663 939 (276) (29.4)%
Average subscriber acquisition costs—per subscriber increased headcount as well as higher bad debt expense associated with higher
(SAC)........................... $ 796 $ 712 $ 84 11.8% revenue.
Subscribers. In 2010, gross subscriber additions decreased primarily due to the Operating profit. The increase in operating profit was primarily due to higher
impact of the transition to digital broadcast in 2009 and lower additions from our operating profit before depreciation and amortization and lower depreciation and
regional telco partners as a result of a more challenging competitive environment. amortization expense in 2010 as a result of decreased subscriber equipment
42