DIRECTV 2010 Annual Report Download - page 57
Download and view the complete annual report
Please find page 57 of the 2010 DIRECTV annual report below. You can navigate through the pages in the report by either clicking on the pages listed below, or by using the keyword search tool below to find specific information within the annual report.-
 1
1 -
2
-
3
-
4
-
5
-
6
-
7
-
8
-
9
-
10
-
11
-
12
-
13
-
14
-
15
-
16
-
17
-
18
-
19
-
20
-
21
-
22
-
23
-
24
-
25
-
26
-
27
-
28
-
29
-
30
-
31
-
32
-
33
-
34
-
35
-
36
-
37
-
38
-
39
-
40
-
41
-
42
-
43
-
44
-
45
-
46
-
 47
47 -
 48
48 -
 49
49 -
 50
50 -
 51
51 -
 52
52 -
 53
53 -
 54
54 -
 55
55 -
 56
56 -
 57
57 -
 58
58 -
 59
59 -
 60
60 -
 61
61 -
 62
62 -
 63
63 -
 64
64 -
 65
65 -
 66
66 -
 67
67 -
68
-
69
-
70
-
71
-
72
-
73
-
74
-
75
-
76
-
77
-
78
-
79
-
80
-
81
-
82
-
83
-
84
-
85
-
86
-
87
-
88
-
89
-
90
-
91
-
92
-
93
-
94
-
95
-
96
-
97
-
98
-
99
-
100
-
101
-
102
-
103
-
104
-
105
-
106
-
107
-
108
-
109
-
110
-
111
-
112
-
113
-
114
-
115
-
116
-
117
-
118
-
119
-
120
-
121
-
122
-
123
-
124
-
125
-
126
-
127
-
128
-
129
-
130
-
131
-
132
-
133
-
134
-
135
-
136
-
137
-
138
-
139
-
140
-
141
-
142
 |
 |

DIRECTV
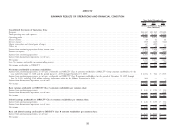
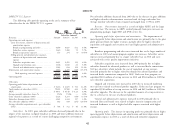
SUMMARY RESULTS OF OPERATIONS AND FINANCIAL CONDITION—(concluded)
Selected Segment Data
Years Ended December 31,
2010 2009 2008
(Dollars in Millions)
DIRECTV U.S.
Revenues ................................................................................................. $20,268 $18,671 $17,310
% of total revenues ........................................................................................... 84.1% 86.6% 87.9%
Operating profit ............................................................................................. $3,290 $ 2,410 $ 2,330
Add: Depreciation and amortization expense ............................................................................ 1,926 2,275 2,061
Operating profit before depreciation and amortization ...................................................................... $5,216 $ 4,685 $ 4,391
Operating profit margin ........................................................................................ 16.2% 12.9% 13.5%
Operating profit before depreciation and amortization margin ................................................................. 25.7% 25.1% 25.4%
Segment assets .............................................................................................. $11,400 $12,408 $12,546
Capital expenditures .......................................................................................... 1,557 1,485 1,765
DIRECTV Latin America
Revenues ................................................................................................. $3,597 $ 2,878 $ 2,383
% of total revenues ........................................................................................... 14.9% 13.3% 12.1%
Operating profit ............................................................................................. $ 623 $ 331 $ 426
Add: Depreciation and amortization expense ............................................................................ 541 366 264
Operating profit before depreciation and amortization ...................................................................... $1,164 $ 697 $ 690
Operating profit margin ........................................................................................ 17.3% 11.5% 17.9%
Operating profit before depreciation and amortization margin ................................................................. 32.4% 24.2% 29.0%
Segment assets .............................................................................................. $4,696 $ 3,772 $ 3,301
Capital expenditures .......................................................................................... 857 584 447
Sports Networks, Eliminations and Other
Revenues ................................................................................................. $ 237 $ 16 —
% of total revenues ........................................................................................... 1.0% 0.1% —
Operating loss .............................................................................................. $ (17) $ (68) $ (61)
Add: Depreciation and amortization expense ............................................................................ 15 (1) (5)
Operating loss before depreciation and amortization ....................................................................... $ (2) $ (69) $ (66)
Segment assets .............................................................................................. $1,813 $ 2,080 $ 692
Capital expenditures .......................................................................................... 2 2 17
Total
Revenues ................................................................................................. $24,102 $21,565 $19,693
Operating profit ............................................................................................. $3,896 $ 2,673 $ 2,695
Add: Depreciation and amortization expense ............................................................................ 2,482 2,640 2,320
Operating profit before depreciation and amortization ...................................................................... $6,378 $ 5,313 $ 5,015
Operating profit margin ........................................................................................ 16.2% 12.4% 13.7%
Operating profit before depreciation and amortization margin ................................................................. 26.5% 24.6% 25.5%
Total assets ................................................................................................ $17,909 $18,260 $16,539
Capital expenditures .......................................................................................... 2,416 2,071 2,229
35