DIRECTV 2010 Annual Report Download - page 68
Download and view the complete annual report
Please find page 68 of the 2010 DIRECTV annual report below. You can navigate through the pages in the report by either clicking on the pages listed below, or by using the keyword search tool below to find specific information within the annual report.-
 1
1 -
2
-
3
-
4
-
5
-
6
-
7
-
8
-
9
-
10
-
11
-
12
-
13
-
14
-
15
-
16
-
17
-
18
-
19
-
20
-
21
-
22
-
23
-
24
-
25
-
26
-
27
-
28
-
29
-
30
-
31
-
32
-
33
-
34
-
35
-
36
-
37
-
38
-
39
-
40
-
41
-
42
-
43
-
44
-
45
-
46
-
47
-
48
-
49
-
50
-
51
-
52
-
53
-
54
-
55
-
56
-
57
-
 58
58 -
 59
59 -
 60
60 -
 61
61 -
 62
62 -
 63
63 -
 64
64 -
 65
65 -
 66
66 -
 67
67 -
 68
68 -
 69
69 -
 70
70 -
 71
71 -
 72
72 -
 73
73 -
 74
74 -
 75
75 -
 76
76 -
 77
77 -
 78
78 -
79
-
80
-
81
-
82
-
83
-
84
-
85
-
86
-
87
-
88
-
89
-
90
-
91
-
92
-
93
-
94
-
95
-
96
-
97
-
98
-
99
-
100
-
101
-
102
-
103
-
104
-
105
-
106
-
107
-
108
-
109
-
110
-
111
-
112
-
113
-
114
-
115
-
116
-
117
-
118
-
119
-
120
-
121
-
122
-
123
-
124
-
125
-
126
-
127
-
128
-
129
-
130
-
131
-
132
-
133
-
134
-
135
-
136
-
137
-
138
-
139
-
140
-
141
-
142
 |
 |

DIRECTV
operating profit, cash flows, net subscriber additions or average monthly subscriber General and administrative expenses increased in 2009 primarily due to
churn. increased labor and benefit expense from the increase in headcount within our
owned and operated home service provider installation business, partially offset by a
Subscribers. In 2009, gross subscriber additions increased primarily due to $14 million charge in 2008 for the write-off of accounts receivable for equipment
more aggressive promotions, marketing of the AT&T/DIRECTV bundle which and other costs incurred to effect the orderly transition of services from one of our
began in February 2009, higher demand for advanced services and the impact of home service providers that ceased operations.
the transition to digital programming by broadcasters in the first half of 2009. Net
subscriber additions increased from 2008 primarily due to the increase in gross Operating profit. The increase in operating profit was primarily due to higher
additions, partially offset by higher subscriber disconnections due to a higher operating profit before depreciation and amortization, partially offset by higher
average monthly churn rate on a larger subscriber base. Average monthly subscriber depreciation and amortization expense in 2009 resulting from the capitalization of
churn increased primarily due to stricter upgrade and retention policies for existing set-top receivers under the lease program.
customers as well as more aggressive competitor promotions combined with a
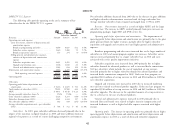
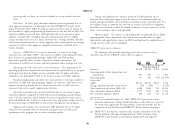
weaker economy. DIRECTV Latin America Segment
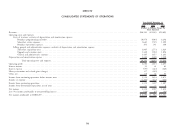
Revenues. DIRECTV U.S.’ revenues increased as a result of the larger The following table provides operating results and a summary of key
subscriber base and higher ARPU. The increase in ARPU resulted primarily from subscriber data for the DIRECTV Latin America segment:
price increases on programming packages, higher HD and DVR product Change
penetration, partially offset by more competitive customer promotions, the 2009 2008 $ %
elimination of satellite lease revenue and lower premium movie package buy rates. (Dollars in Millions, Except Per
Subscriber Amounts)
Operating profit before depreciation and amortization. The improvement of Revenues ......................... $2,878 $2,383 $ 495 20.8%
operating profit before depreciation and amortization was primarily due to the gross Operating profit before depreciation and
profit generated from the higher revenues, partially offset by higher subscriber amortization ...................... 697 690 7 1.0%
acquisition costs principally related to the increase in gross subscriber additions. Operating profit ..................... 331 426 (95) (22.3)%
Broadcast programming and other costs increased due to the larger number of Other data:
subscribers in 2009 and annual program supplier rate increases. Subscriber service ARPU ........................... $57.12 $55.07 $2.05 3.7%
expenses increased primarily due to a larger subscriber base in 2009 and costs Average monthly subscriber churn % (1) .... 1.75% 1.78% — (1.7)%
associated with service quality improvement initiatives. Total number of subscribers (000’s) (2) ...... 4,588 3,883 705 18.2%
Gross subscriber additions (000’s) ......... 1,575 1,393 182 13.1%
Subscriber acquisition costs increased primarily due to an increase in gross Net subscriber additions (000’s) .......... 692 623 69 11.1%
subscriber additions compared to 2008 and increased marketing and advertising
costs. SAC per subscriber, which includes the cost of capitalized set-top receivers, (1) In the year ended December 31, 2008, DIRECTV Latin America had a
decreased primarily due to lower set-top receiver costs and greater savings related to subscriber adjustment totaling 78,000 subscribers in Sky Brazil as a result of
the increased usage of refurbished set-top receivers through our lease program. the inconsistent application of churn policies in previous periods and the
Upgrade and retention costs increased in 2009 primarily due to the larger completion of the Sky Brazil and DIRECTV Brazil business integration.
subscriber base, partially offset by decreased installation costs and decreased (2) DIRECTV Latin America subscriber data excludes subscribers of the Sky
spending on other programs due to stricter spending policies. Mexico platform. We migrated approximately 3,000 subscribers from
DIRECTV Latin America to Sky Mexico during 2009 and migrated
46