DIRECTV 2010 Annual Report Download - page 118
Download and view the complete annual report
Please find page 118 of the 2010 DIRECTV annual report below. You can navigate through the pages in the report by either clicking on the pages listed below, or by using the keyword search tool below to find specific information within the annual report.-
 1
1 -
2
-
3
-
4
-
5
-
6
-
7
-
8
-
9
-
10
-
11
-
12
-
13
-
14
-
15
-
16
-
17
-
18
-
19
-
20
-
21
-
22
-
23
-
24
-
25
-
26
-
27
-
28
-
29
-
30
-
31
-
32
-
33
-
34
-
35
-
36
-
37
-
38
-
39
-
40
-
41
-
42
-
43
-
44
-
45
-
46
-
47
-
48
-
49
-
50
-
51
-
52
-
53
-
54
-
55
-
56
-
57
-
58
-
59
-
60
-
61
-
62
-
63
-
64
-
65
-
66
-
67
-
68
-
69
-
70
-
71
-
72
-
73
-
74
-
75
-
76
-
77
-
78
-
79
-
80
-
81
-
82
-
83
-
84
-
85
-
86
-
87
-
88
-
89
-
90
-
91
-
92
-
93
-
94
-
95
-
96
-
97
-
98
-
99
-
100
-
101
-
102
-
103
-
104
-
105
-
106
-
107
-
 108
108 -
 109
109 -
 110
110 -
 111
111 -
 112
112 -
 113
113 -
 114
114 -
 115
115 -
 116
116 -
 117
117 -
 118
118 -
 119
119 -
 120
120 -
 121
121 -
 122
122 -
 123
123 -
 124
124 -
 125
125 -
 126
126 -
 127
127 -
 128
128 -
129
-
130
-
131
-
132
-
133
-
134
-
135
-
136
-
137
-
138
-
139
-
140
-
141
-
142
 |
 |

DIRECTV
NOTES TO THE CONSOLIDATED FINANCIAL STATEMENTS—(continued)
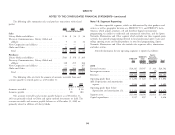
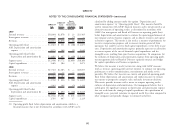
The following represents a reconciliation of operating profit before The following table presents revenues earned from subscribers located in
depreciation and amortization to reported net income on the Consolidated different geographic areas. Property is grouped by its physical location.
Statements of Operations: Years Ended and As of December 31,
2010 2009 2008
Years Ended December 31,
Net Property Net Property Net Property
2010 2009 2008 Revenues & Satellites Revenues & Satellites Revenues & Satellites
(Dollars in Millions) (Dollars in Millions)
Operating profit before depreciation and United States ................$20,684 $4,987 $18,844 $5,247 $17,454 $5,728
amortization ......................... $6,378 $ 5,313 $ 5,015 Latin America and the Caribbean ..... 3,418 1,692 2,721 1,229 2,239 919
Depreciation and amortization expense ......... (2,482) (2,640) (2,320) Total ...................$24,102 $6,679 $21,565 $6,476 $19,693 $6,647
Operating profit ........................ 3,896 2,673 2,695
Interest income ........................ 39 41 81 Note 19: Commitments and Contingencies
Interest expense ........................ (557) (423) (360) Commitments
Liberty transaction and related gains (charges) .... 67 (491) —
Other, net ............................ 69 34 55 At December 31, 2010, minimum future commitments under noncancelable
operating leases having lease terms in excess of one year were primarily for satellite
Income from continuing operations before income transponder leases and real property and aggregated $434 million, payable as
taxes.............................. 3,514 1,834 2,471 follows: $77 million in 2011, $64 million in 2012, $59 million in 2013,
Income tax expense ...................... (1,202) (827) (864) $45 million in 2014, $37 million in 2015 and $152 million thereafter. Certain of
Income from continuing operations ........... 2,312 1,007 1,607 these leases contain escalation clauses and renewal or purchase options, which we
Income from discontinued operations, net of taxes . — — 6 have not considered in the amounts disclosed. Rental expenses under operating
Net income ........................... 2,312 1,007 1,613 leases were $78 million in 2010, $72 million in 2009 and $95 million in 2008.
Less: Net income attributable to noncontrolling At December 31, 2010, our minimum payments under agreements to purchase
interests ............................ (114) (65) (92) broadcast programming, regional professional team rights and the purchase of
Net income attributable to DIRECTV ......... $2,198 $ 942 $ 1,521 services that we have outsourced to third parties, such as billing services, and
satellite telemetry, tracking and control, satellite launch contracts and broadcast
center services aggregated $9,001 million, payable as follows: $2,029 million in
2011, $2,092 million in 2012, $1,688 million in 2013, $1,364 million in 2014,
$818 million in 2015 and $1,010 million thereafter.
As of December 31, 2010, other long-term obligations totaling $136 million
and are payable in 2011. These amounts are recorded in ‘‘Accounts payable and
accrued liabilities’’ in the Consolidated Balance Sheets.
96