DIRECTV 2010 Annual Report Download - page 65
Download and view the complete annual report
Please find page 65 of the 2010 DIRECTV annual report below. You can navigate through the pages in the report by either clicking on the pages listed below, or by using the keyword search tool below to find specific information within the annual report.-
 1
1 -
2
-
3
-
4
-
5
-
6
-
7
-
8
-
9
-
10
-
11
-
12
-
13
-
14
-
15
-
16
-
17
-
18
-
19
-
20
-
21
-
22
-
23
-
24
-
25
-
26
-
27
-
28
-
29
-
30
-
31
-
32
-
33
-
34
-
35
-
36
-
37
-
38
-
39
-
40
-
41
-
42
-
43
-
44
-
45
-
46
-
47
-
48
-
49
-
50
-
51
-
52
-
53
-
54
-
 55
55 -
 56
56 -
 57
57 -
 58
58 -
 59
59 -
 60
60 -
 61
61 -
 62
62 -
 63
63 -
 64
64 -
 65
65 -
 66
66 -
 67
67 -
 68
68 -
 69
69 -
 70
70 -
 71
71 -
 72
72 -
 73
73 -
 74
74 -
 75
75 -
76
-
77
-
78
-
79
-
80
-
81
-
82
-
83
-
84
-
85
-
86
-
87
-
88
-
89
-
90
-
91
-
92
-
93
-
94
-
95
-
96
-
97
-
98
-
99
-
100
-
101
-
102
-
103
-
104
-
105
-
106
-
107
-
108
-
109
-
110
-
111
-
112
-
113
-
114
-
115
-
116
-
117
-
118
-
119
-
120
-
121
-
122
-
123
-
124
-
125
-
126
-
127
-
128
-
129
-
130
-
131
-
132
-
133
-
134
-
135
-
136
-
137
-
138
-
139
-
140
-
141
-
142
 |
 |

DIRECTV
capitalization and completion of the amortization of subscriber related and orbital The higher operating profit before depreciation and amortization was primarily
slot intangible assets. from the increased gross profit generated from the higher revenues, coupled with
lower general and administrative expenses primarily due to a decrease of
DIRECTV Latin America Segment $191 million in the charges related to the exchange of Venezuelan currency. This
was partially offset by an increase in subscriber acquisition costs due to a higher
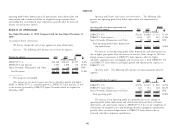
The following table provides operating results and a summary of key number of gross subscriber additions.
subscriber data for the DIRECTV Latin America segment:
The increase in operating profit was primarily due to higher operating profit
Change before depreciation and amortization, partially offset by higher depreciation and
2010 2009 $ % amortization expense resulting from an increase in basic and advanced product
(Dollars in Millions, Except Per receivers capitalized related to the higher gross subscriber additions attained over the
Subscriber Amounts) last year.
Revenues ......................... $3,597 $2,878 $ 719 25.0%
Operating profit before depreciation and Sports Networks, Eliminations and Other
amortization ..................... 1,164 697 467 67.0%
Operating profit .................... 623 331 292 88.2% Operating loss from Sports Networks, Elimination and Other decreased to
Other data: $17 million in 2010 from $68 million in 2009. Sports Networks, Eliminations and
ARPU ........................... $57.95 $57.12 $ 0.83 1.5% Other primarily consisted of corporate operating costs until November 19, 2009
Average monthly subscriber churn % ....... 1.77% 1.75% — 1.1% when we completed the Liberty Transaction and acquired the RSNs.
Total number of subscribers (000’s) (1) ..... 5,808 4,588 1,220 26.6%
Gross subscriber additions (000’s) ......... 2,318 1,575 743 47.2% Year Ended December 31, 2009 Compared with the Year Ended December 31,
Net subscriber additions (000’s) .......... 1,220 692 528 76.3% 2008
Consolidated Results of Operations
(1) DIRECTV Latin America subscriber data exclude subscribers of the Sky
Mexico platform. Net subscriber additions and churn exclude the effect of the We discuss changes for each of our segments in more detail below.
migration of approximately 3,000 subscribers to Sky Mexico and the migration
Revenues. The following table presents our revenues by segment:
of approximately 16,000 subscribers from a local pay television service provider
to Sky Brazil in 2009. Change
Gross subscriber additions increased in 2010 principally due to continued Revenues by segment: 2009 2008 $ %
strong demand for advanced products and prepaid services, the effect of the FIFA (Dollars in Millions)
World Cup soccer tournament as well as targeted customer promotions aimed at DIRECTV U.S. .................. $18,671 $17,310 $1,361 7.9%
the middle-market segments. The increase in net subscriber additions was due to DIRECTV Latin America ............ 2,878 2,383 495 20.8%
higher gross subscriber additions primarily in Brazil, Argentina, Colombia, Ecuador Sports Networks, Eliminations and Other . . 16 — 16 NM
and Chile. Total Revenues .................. $21,565 $19,693 $1,872 9.5%
Revenues increased in 2010 primarily due to strong subscriber growth. ARPU The increase in our total revenues was due to subscriber growth and higher
increased mainly due to price increases and higher fees for HD and DVR services, ARPU at DIRECTV U.S. and DIRECTV Latin America.
partially offset by the effect of the devaluation in Venezuela and the increased
penetration of the middle-market segment.
43