Cincinnati Bell 2012 Annual Report Download - page 87
Download and view the complete annual report
Please find page 87 of the 2012 Cincinnati Bell annual report below. You can navigate through the pages in the report by either clicking on the pages listed below, or by using the keyword search tool below to find specific information within the annual report.
Form 10-K Part I Cincinnati Bell Inc.
Customers
Over the past five years, revenues from data center colocation services, business data transport and wireline
entertainment has continued to grow, while revenue from the Company’s legacy products, such as wireline
residential voice service and wireless voice services, have decreased. The Company’s revenue portfolio is
becoming more diversified than in the past, as the following comparison between 2012 revenue and 2007
revenue demonstrates.
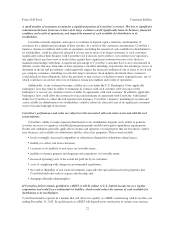
Percentage of revenue 2012 2007 Change
Wireline local voice ...................................... 17% 31% (14)pts
Wireless ............................................... 16% 21% (5)
Data Center Colocation ................................... 15% 2% 13
IT Services and Hardware ................................. 21% 17% 4
Wireline data ........................................... 20% 19% 1
Wireline entertainment .................................... 2% 0% 2
Other Wireline, including long distance ...................... 9% 10% (1)
Total .................................................. 100% 100%
The mix of customer demand for Wireless services is trending toward more data services and less voice
services. For 2007, Wireless service revenues were comprised of 84% voice services and 16% data services. In
2012, revenue from data services were 36% of total Wireless service revenues, a 20 point increase from 2007.
Additionally, the Company’s mix of business and residential customers is changing, as many of the
Company’s growth products, such as data center services and data transport services, are geared primarily toward
business customers. In 2012, the Company’s revenue mix was 68% to business customers and 32% to residential
customers. By comparison, the Company’s 2007 revenues were comprised of 57% to business customers and
43% to residential customers.
The Company has receivables with one large customer that exceed 10% of the Company’s outstanding
accounts receivable balance at December 31, 2012 and 2011.
As noted in the Data Center Colocation section above, our data center colocation marketing efforts were
focused toward large enterprise customers. At December 31, 2012, CyrusOne had over 100 customers that are
Fortune 1000 or comparably sized international and privately-held companies.
We expect our mix of revenues to change in 2013. Effective with the completion of the IPO of CyrusOne,
we will no longer recognize data center colocation revenue in our consolidated financial statements. Rather, we
will recognize income from our investment in CyrusOne LP on the equity method and dividend income from our
investment in CyrusOne.
Employees
At December 31, 2012, the Company had approximately 3,100 employees, and approximately 24% of its
employees are covered under a collective bargaining agreement with the Communications Workers of America
(“CWA”), which is affiliated with the AFL-CIO. This agreement expires on August 9, 2014.
Executive Officers
Refer to Part III, Item 10. “Directors, Executive Officers and Corporate Governance” of this Annual Report
on Form 10-K for information regarding executive officers of the registrant.
Business Segment Information
The amounts of revenue, intersegment revenue, operating income, expenditures for long-lived assets, and
depreciation and amortization attributable to each of the Company’s business segments for the years ended
December 31, 2012, 2011, and 2010, and assets as of December 31, 2012, 2011, and 2010, are set forth in Note
15 to the Consolidated Financial Statements.
13
Form 10-K


