Cincinnati Bell 2012 Annual Report Download - page 136
Download and view the complete annual report
Please find page 136 of the 2012 Cincinnati Bell annual report below. You can navigate through the pages in the report by either clicking on the pages listed below, or by using the keyword search tool below to find specific information within the annual report.-
 1
1 -
2
-
3
-
4
-
5
-
6
-
7
-
8
-
9
-
10
-
11
-
12
-
13
-
14
-
15
-
16
-
17
-
18
-
19
-
20
-
21
-
22
-
23
-
24
-
25
-
26
-
27
-
28
-
29
-
30
-
31
-
32
-
33
-
34
-
35
-
36
-
37
-
38
-
39
-
40
-
41
-
42
-
43
-
44
-
45
-
46
-
47
-
48
-
49
-
50
-
51
-
52
-
53
-
54
-
55
-
56
-
57
-
58
-
59
-
60
-
61
-
62
-
63
-
64
-
65
-
66
-
67
-
68
-
69
-
70
-
71
-
72
-
73
-
74
-
75
-
76
-
77
-
78
-
79
-
80
-
81
-
82
-
83
-
84
-
85
-
86
-
87
-
88
-
89
-
90
-
91
-
92
-
93
-
94
-
95
-
96
-
97
-
98
-
99
-
100
-
101
-
102
-
103
-
104
-
105
-
106
-
107
-
108
-
109
-
110
-
111
-
112
-
113
-
114
-
115
-
116
-
117
-
118
-
119
-
120
-
121
-
122
-
123
-
124
-
125
-
 126
126 -
 127
127 -
 128
128 -
 129
129 -
 130
130 -
 131
131 -
 132
132 -
 133
133 -
 134
134 -
 135
135 -
 136
136 -
 137
137 -
 138
138 -
 139
139 -
 140
140 -
 141
141 -
 142
142 -
 143
143 -
 144
144 -
 145
145 -
 146
146 -
147
-
148
-
149
-
150
-
151
-
152
-
153
-
154
-
155
-
156
-
157
-
158
-
159
-
160
-
161
-
162
-
163
-
164
-
165
-
166
-
167
-
168
-
169
-
170
-
171
-
172
-
173
-
174
-
175
-
176
-
177
-
178
-
179
-
180
-
181
-
182
-
183
-
184
-
185
-
186
-
187
-
188
-
189
-
190
-
191
-
192
-
193
-
194
-
195
-
196
-
197
-
198
-
199
-
200
-
201
-
202
-
203
-
204
-
205
-
206
-
207
-
208
-
209
-
210
-
211
-
212
-
213
-
214
-
215
-
216
 |
 |

calculating the expenses and liabilities related to these plans. The most significant of these numerous
assumptions, which are reviewed annually, include the discount rate, expected long-term rate of return on plan
assets and healthcare cost trend rates.
Discount rate
A discount rate is used to measure the present value of projected benefit obligations. The discount rate for each
plan is individually calculated based upon the timing of expected future benefit payments. Our discount rates are
derived based upon a yield curve developed to reflect yields available on high-quality corporate bonds as of the
measurement date. As of December 31, 2012 and 2011, the discount rate used to value the pension plans was 3.30%
and 3.90%, respectively, while the discount rate used to value the postretirement plans was 3.10% and 3.60%.
Lower rates of interest available on high-quality corporate bonds drove the decrease in the discount rates in 2012.
Expected rate of return
The expected long-term rate of return on plan assets, developed using the building block approach, is based
on the mix of investments held directly by the plans, and the current view of expected future returns, which is
influenced by historical averages. The required use of an expected versus actual long-term rate of return on plan
assets may result in recognized pension expense or income that is greater or less than the actual returns of those
plan assets in any given year. Over time, however, the expected long-term returns are designed to approximate
the actual long-term returns. As of December 31, 2012 and 2011, the estimated long-term rate of return on
pension plan assets was 7.75%. The long-term rate of return on postretirement plan assets was estimated to be
zero in both periods as these plans have minimal assets with a low rate of return. Actual asset returns for the
pension trusts, which represent over 90% of invested assets, were gains of 15% in 2012, 6% in 2011, and 14% in
2010. In our pension calculations, we utilized the market-related value of plan assets, which is a calculated asset
value that recognizes changes in asset fair values in a systematic and consistent manner. Differences between
actual and expected returns are recognized in the market-related value of plan assets over five years.
Healthcare cost trend
Our healthcare cost trend rate is developed based on historical cost data, the near-term outlook, and an
assessment of likely long-term trends. As of both December 31, 2012 and 2011, the healthcare cost trend rate
used to measure the postretirement health benefit obligation was 6.5% and 8.0%, respectively. As of
December 31, 2012, the healthcare cost trend rate is assumed to decrease gradually to 4.5% by the year 2016.
The actuarial assumptions used may differ materially from actual results due to the changing market and
economic conditions and other changes. Revisions to and variations from these estimates would impact assets,
liabilities, equity, cash flow, costs of services and products, and selling, general and administrative expenses.
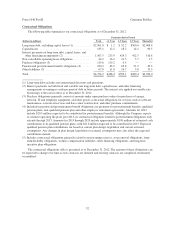
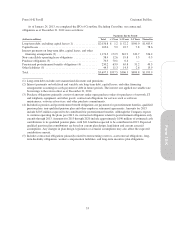
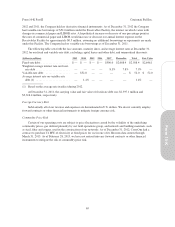
The following table represents the sensitivity of changes in certain assumptions related to the pension and
postretirement plans as of December 31, 2012:
Pension Benefits Postretirement and Other Benefits
(dollars in millions)
% Point
Change
Increase/
(Decrease) in
Obligation
Increase/
(Decrease) in
Expense
Increase/
(Decrease) in
Obligation
Increase/
(Decrease) in
Expense
Discount rate ......................... +/-0.5% $28.5/($28.5) $0.9/($0.9) $6.2/($5.7) $0.1/(0.1)
Expected return on assets ............... +/-0.5% n/a $1.7/($1.7) n/a $0.1/(0.1)
Healthcare cost trend rate ............... +/-1.0% n/a n/a $5.4/($4.8) $0.2/($0.2)
At December 31, 2012 and 2011, unrecognized actuarial net losses were $399.8 million and $411.6 million,
respectively. The unrecognized net losses have been primarily generated by differences between assumed and
actual rates of return on invested assets, changes in discount rates, and healthcare costs. Because gains and losses
reflect refinements in estimates as well as real changes in economic values and because some gains in one period
may be offset by losses in another or vice versa, we are not required to recognize these gains and losses in the
period that they occur. Instead, if the gains and losses exceed a 10% corridor defined in the accounting literature,
62
Form 10-K Part II Cincinnati Bell Inc.