Cincinnati Bell 2012 Annual Report Download - page 178
Download and view the complete annual report
Please find page 178 of the 2012 Cincinnati Bell annual report below. You can navigate through the pages in the report by either clicking on the pages listed below, or by using the keyword search tool below to find specific information within the annual report.-
 1
1 -
2
-
3
-
4
-
5
-
6
-
7
-
8
-
9
-
10
-
11
-
12
-
13
-
14
-
15
-
16
-
17
-
18
-
19
-
20
-
21
-
22
-
23
-
24
-
25
-
26
-
27
-
28
-
29
-
30
-
31
-
32
-
33
-
34
-
35
-
36
-
37
-
38
-
39
-
40
-
41
-
42
-
43
-
44
-
45
-
46
-
47
-
48
-
49
-
50
-
51
-
52
-
53
-
54
-
55
-
56
-
57
-
58
-
59
-
60
-
61
-
62
-
63
-
64
-
65
-
66
-
67
-
68
-
69
-
70
-
71
-
72
-
73
-
74
-
75
-
76
-
77
-
78
-
79
-
80
-
81
-
82
-
83
-
84
-
85
-
86
-
87
-
88
-
89
-
90
-
91
-
92
-
93
-
94
-
95
-
96
-
97
-
98
-
99
-
100
-
101
-
102
-
103
-
104
-
105
-
106
-
107
-
108
-
109
-
110
-
111
-
112
-
113
-
114
-
115
-
116
-
117
-
118
-
119
-
120
-
121
-
122
-
123
-
124
-
125
-
126
-
127
-
128
-
129
-
130
-
131
-
132
-
133
-
134
-
135
-
136
-
137
-
138
-
139
-
140
-
141
-
142
-
143
-
144
-
145
-
146
-
147
-
148
-
149
-
150
-
151
-
152
-
153
-
154
-
155
-
156
-
157
-
158
-
159
-
160
-
161
-
162
-
163
-
164
-
165
-
166
-
167
-
 168
168 -
 169
169 -
 170
170 -
 171
171 -
 172
172 -
 173
173 -
 174
174 -
 175
175 -
 176
176 -
 177
177 -
 178
178 -
 179
179 -
 180
180 -
 181
181 -
 182
182 -
 183
183 -
 184
184 -
 185
185 -
 186
186 -
 187
187 -
 188
188 -
189
-
190
-
191
-
192
-
193
-
194
-
195
-
196
-
197
-
198
-
199
-
200
-
201
-
202
-
203
-
204
-
205
-
206
-
207
-
208
-
209
-
210
-
211
-
212
-
213
-
214
-
215
-
216
 |
 |

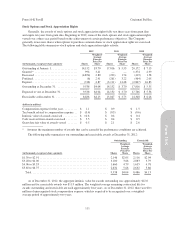
The following are the weighted-average assumptions used in measuring the net periodic cost of the pension
and postretirement benefits:
Pension Benefits
Postretirement and Other
Benefits
2012 2011 2010 2012 2011 2010
Discount rate ................................... 3.90% 4.90% 5.50% 3.60% 4.50% 5.10%
Expected long-term rate of return ................... 7.75% 8.25% 8.25% 0% 0% 0%
Future compensation growth rate ................... 3.00% 3.00% 3.00% — — —
The expected long-term rate of return on plan assets, developed using the building block approach, is based
on the mix of investments held directly by the plans and the current view of expected future returns, which is
influenced by historical averages. Changes in actual asset return experience and discount rate assumptions can
impact the Company’s operating results, financial position and cash flows.
Benefit Obligation and Funded Status
Changes in the plans’ benefit obligations and funded status are as follows:
Pension Benefits
Postretirement and
Other Benefits
(dollars in millions) 2012 2011 2012 2011
Change in benefit obligation:
Benefit obligation at January 1, ................................. $569.2 $ 526.1 $ 164.9 $ 163.5
Service cost .............................................. 2.6 5.1 0.5 0.3
Interest cost .............................................. 21.3 24.8 5.6 7.1
Actuarial loss ............................................. 30.6 60.2 2.2 13.8
Benefits paid ............................................. (38.8) (47.0) (26.0) (27.2)
Retiree drug subsidy received ................................ — — 0.6 0.7
Early retiree subsidy received (refunded) ....................... — — (0.1) 1.9
Other ................................................... — — 4.7 4.8
Benefit obligation at December 31, .............................. $584.9 $ 569.2 $ 152.4 $ 164.9
Change in plan assets:
Fair value of plan assets at January 1, ............................ $312.5 $ 324.0 $ 12.1 $ 12.3
Actual return on plan assets .................................. 44.2 15.4 0.4 0.3
Employer contributions ..................................... 25.9 20.1 24.7 24.1
Retiree drug subsidy received ................................ — — 0.6 0.7
Early retiree subsidy received (refunded) ....................... — — (0.1) 1.9
Benefits paid ............................................. (38.8) (47.0) (26.0) (27.2)
Fair value of plan assets at December 31, ......................... 343.8 312.5 11.7 12.1
Unfunded status ............................................. $(241.1) $(256.7) $(140.7) $(152.8)
The following are the weighted-average assumptions used in accounting for and measuring the projected
benefit obligations:
Pension Benefits
Postretirement and
Other Benefits
December 31, December 31,
2012 2011 2012 2011
Discount rate ................................................ 3.30% 3.90% 3.10% 3.60%
Expected long-term rate of return ................................ 7.75% 7.75% 0% 0%
Future compensation growth rate ................................. 3.00% 3.00% — —
104
Form 10-K Part II Cincinnati Bell Inc.