Cincinnati Bell 2012 Annual Report Download - page 116
Download and view the complete annual report
Please find page 116 of the 2012 Cincinnati Bell annual report below. You can navigate through the pages in the report by either clicking on the pages listed below, or by using the keyword search tool below to find specific information within the annual report.-
 1
1 -
2
-
3
-
4
-
5
-
6
-
7
-
8
-
9
-
10
-
11
-
12
-
13
-
14
-
15
-
16
-
17
-
18
-
19
-
20
-
21
-
22
-
23
-
24
-
25
-
26
-
27
-
28
-
29
-
30
-
31
-
32
-
33
-
34
-
35
-
36
-
37
-
38
-
39
-
40
-
41
-
42
-
43
-
44
-
45
-
46
-
47
-
48
-
49
-
50
-
51
-
52
-
53
-
54
-
55
-
56
-
57
-
58
-
59
-
60
-
61
-
62
-
63
-
64
-
65
-
66
-
67
-
68
-
69
-
70
-
71
-
72
-
73
-
74
-
75
-
76
-
77
-
78
-
79
-
80
-
81
-
82
-
83
-
84
-
85
-
86
-
87
-
88
-
89
-
90
-
91
-
92
-
93
-
94
-
95
-
96
-
97
-
98
-
99
-
100
-
101
-
102
-
103
-
104
-
105
-
 106
106 -
 107
107 -
 108
108 -
 109
109 -
 110
110 -
 111
111 -
 112
112 -
 113
113 -
 114
114 -
 115
115 -
 116
116 -
 117
117 -
 118
118 -
 119
119 -
 120
120 -
 121
121 -
 122
122 -
 123
123 -
 124
124 -
 125
125 -
 126
126 -
127
-
128
-
129
-
130
-
131
-
132
-
133
-
134
-
135
-
136
-
137
-
138
-
139
-
140
-
141
-
142
-
143
-
144
-
145
-
146
-
147
-
148
-
149
-
150
-
151
-
152
-
153
-
154
-
155
-
156
-
157
-
158
-
159
-
160
-
161
-
162
-
163
-
164
-
165
-
166
-
167
-
168
-
169
-
170
-
171
-
172
-
173
-
174
-
175
-
176
-
177
-
178
-
179
-
180
-
181
-
182
-
183
-
184
-
185
-
186
-
187
-
188
-
189
-
190
-
191
-
192
-
193
-
194
-
195
-
196
-
197
-
198
-
199
-
200
-
201
-
202
-
203
-
204
-
205
-
206
-
207
-
208
-
209
-
210
-
211
-
212
-
213
-
214
-
215
-
216
 |
 |

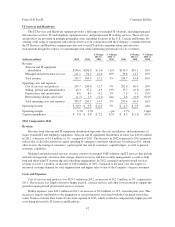
IT Services and Hardware
The IT Services and Hardware segment provides a full range of managed IT solutions, including managed
infrastructure services, IT and telephony equipment sales, and professional IT staffing services. These services
and products are provided in multiple geographic areas including locations in the U.S., Canada and Europe. By
offering a full range of equipment and outsourced services in conjunction with the Company’s wireline network,
the IT Services and Hardware segment provides end-to-end IT and telecommunications infrastructure
management designed to reduce cost and mitigate risk while optimizing performance for its customers.
(dollars in millions) 2012 2011
$ Change
2012 vs.
2011
% Change
2012 vs.
2011 2010
$ Change
2011 vs.
2010
% Change
2011 vs.
2010
Revenue:
Telecom and IT equipment
distribution .................... $204.6 $206.0 $ (1.4) (1)% $174.9 $31.1 18%
Managed and professional services . . . 111.1 94.5 16.6 18% 79.8 14.7 18%
Total revenue .................... 315.7 300.5 15.2 5% 254.7 45.8 18%
Operating costs and expenses:
Cost of services and products ....... 255.7 243.0 12.7 5% 202.6 40.4 20%
Selling, general and administrative . . . 42.3 37.4 4.9 13% 37.7 (0.3) (1)%
Depreciation and amortization ...... 8.6 8.4 0.2 2% 7.3 1.1 15%
Restructuring charges (reversals) .... (1.2) 1.9 (3.1) n/m 2.8 (0.9) (32)%
Total operating costs and expenses . . . 305.4 290.7 14.7 5% 250.4 40.3 16%
Operating income .................. $ 10.3 $ 9.8 $ 0.5 5% $ 4.3 $ 5.5 n/m
Operating margin ................... 3.3% 3.3% —pts 1.7% 1.6pts
Capital expenditures ................ $ 9.0 $ 6.8 $ 2.2 32% $ 8.3 $(1.5) (18)%
2012 Compared to 2011
Revenue
Revenue from telecom and IT equipment distribution represents the sale, installation, and maintenance of
major, branded IT and telephony equipment. Telecom and IT equipment distribution revenue was $204.6 million
in 2012, a decrease of $1.4 million, or 1%, compared to 2011. The decrease in 2012 compared to 2011 primarily
reflects the cyclical fluctuation in capital spending by enterprise customers which may be influenced by, among
other factors, the timing of customers’ capital spend, the size of customers’ capital budgets, as well as general
economic conditions.
Managed and professional services revenue consists of managed VoIP solutions and IT services that include
network management, electronic data storage, disaster recovery and data security management, as well as both
long and short-term IT outsourcing and consulting engagements. In 2012, managed and professional services
revenue was $111.1 million, an increase of $16.6 million, or 18%, compared to the prior year due largely to
increased customer demand for staff augmentation and higher sales to one of the Company’s largest customers.
Costs and Expenses
Cost of services and products was $255.7 million in 2012, an increase of $12.7 million, or 5%, compared to
2011. The increase was largely driven by higher payroll, contract services and other costs incurred to support the
growth in managed and professional services revenue.
SG&A expenses were $42.3 million in 2012, an increase of $4.9 million, or 13%, from the prior year. This
increase is largely attributable to the integration of certain functions associated with the Cincinnati-based data
center business into the Data Center Colocation segment in 2012, which resulted in comparatively higher payroll
costs being incurred by IT Services and Hardware.
42
Form 10-K Part II Cincinnati Bell Inc.