Cincinnati Bell 2012 Annual Report Download - page 46
Download and view the complete annual report
Please find page 46 of the 2012 Cincinnati Bell annual report below. You can navigate through the pages in the report by either clicking on the pages listed below, or by using the keyword search tool below to find specific information within the annual report.-
 1
1 -
2
-
3
-
4
-
5
-
6
-
7
-
8
-
9
-
10
-
11
-
12
-
13
-
14
-
15
-
16
-
17
-
18
-
19
-
20
-
21
-
22
-
23
-
24
-
25
-
26
-
27
-
28
-
29
-
30
-
31
-
32
-
33
-
34
-
35
-
 36
36 -
 37
37 -
 38
38 -
 39
39 -
 40
40 -
 41
41 -
 42
42 -
 43
43 -
 44
44 -
 45
45 -
 46
46 -
 47
47 -
 48
48 -
 49
49 -
 50
50 -
 51
51 -
 52
52 -
 53
53 -
 54
54 -
 55
55 -
 56
56 -
57
-
58
-
59
-
60
-
61
-
62
-
63
-
64
-
65
-
66
-
67
-
68
-
69
-
70
-
71
-
72
-
73
-
74
-
75
-
76
-
77
-
78
-
79
-
80
-
81
-
82
-
83
-
84
-
85
-
86
-
87
-
88
-
89
-
90
-
91
-
92
-
93
-
94
-
95
-
96
-
97
-
98
-
99
-
100
-
101
-
102
-
103
-
104
-
105
-
106
-
107
-
108
-
109
-
110
-
111
-
112
-
113
-
114
-
115
-
116
-
117
-
118
-
119
-
120
-
121
-
122
-
123
-
124
-
125
-
126
-
127
-
128
-
129
-
130
-
131
-
132
-
133
-
134
-
135
-
136
-
137
-
138
-
139
-
140
-
141
-
142
-
143
-
144
-
145
-
146
-
147
-
148
-
149
-
150
-
151
-
152
-
153
-
154
-
155
-
156
-
157
-
158
-
159
-
160
-
161
-
162
-
163
-
164
-
165
-
166
-
167
-
168
-
169
-
170
-
171
-
172
-
173
-
174
-
175
-
176
-
177
-
178
-
179
-
180
-
181
-
182
-
183
-
184
-
185
-
186
-
187
-
188
-
189
-
190
-
191
-
192
-
193
-
194
-
195
-
196
-
197
-
198
-
199
-
200
-
201
-
202
-
203
-
204
-
205
-
206
-
207
-
208
-
209
-
210
-
211
-
212
-
213
-
214
-
215
-
216
 |
 |

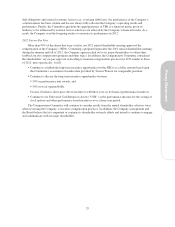
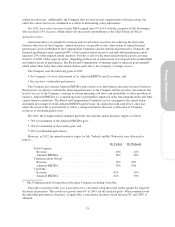
The Adjusted EBITDA and revenue goals are assessed independently of each other and are scaled above and
below their respective targets in the manner set out below.
Percentage of
Criterion Achieved
Adjusted EBITDA Goal Revenue Goal
Percentage of
Target Incentive
Goal
Percentage of
Total Annual
Incentive
Paid
Percentage of
Target Incentive
Goal
Percentage of
Total Annual
Incentive
Paid
Below 95% ................................ 0% 0% 0% 0%
95% ...................................... 50% 35% 50% 5%
100% ..................................... 100% 70% 100% 10%
105% ..................................... 150% 105% 150% 15%
120% or greater ............................. 200% 140% 200% 20%
The 2012 target annual incentives for each of the NEOs are set forth below:
Named Executive Officer
Target Annual Incentive
as a % of Base Salary
John F. Cassidy .......................................... 150%
Kurt A. Freyberger ........................................ 100%
Theodore H. Torbeck ...................................... 100%
Gary J. Wojtaszek ........................................ 100%
Christopher J. Wilson ..................................... 65%
The higher percentage for Mr. Cassidy reflected his additional responsibility, knowledge, strategic judgment
and leadership required of the Chief Executive Officer compared to the other NEOs.
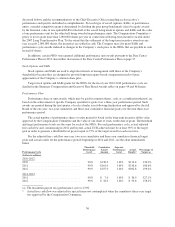
In 2012, for annual incentive purposes, the chart below sets out the Adjusted EBITDA and revenue target
goals and actual results:
Financial Objective
2012
Threshold
Performance
Level 2012 Target
2012
Superior
Performance
Level
2012 Actual
Results
Adjusted EBITDA .................................. 95% $530M 120% $543 M*
Revenue .......................................... 95% $1.47 B 120% $1.47 B
* The Compensation Committee approved an $8 million adjustment to increase Adjusted EBITDA by the
mark-to-market charge on incentive awards indexed to the Company’s common stock price, resulting from
an 81% increase in the market price of Cincinnati Bell’s common stock in 2012.
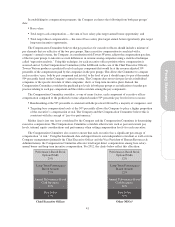
The Chief Executive Officer provides the Compensation Committee with his assessment of each executive
officer’s individual performance. The Chief Executive Officer is given discretion by the Compensation
Committee in assessing performance, but, in general, the Chief Executive Officer reviews, for each executive
officer, the performance of the executive’s department, the quality of the executive’s advice and counsel on
matters within the executive’s purview, qualitative peer feedback and the effectiveness of the executive’s
communication with the organization and with the Chief Executive Officer on matters of topical concern. These
factors are evaluated subjectively and are not assigned specific individual weight. The Chief Executive Officer
then recommends an award for the individual performance-based portion for each of the other NEO’s annual
incentive, which generally ranges from 0% to 200% of the target award for such portion.
The Compensation Committee meets in executive session to consider the Chief Executive Officer’s
individual performance. The Compensation Committee evaluates the information obtained from the other
directors concerning the Chief Executive Officer’s individual performance, based on a discussion led by the
Chairman of the Board. Factors considered include: operational and financial performance, succession planning,
development of the Company leadership team, development of business opportunities and community
involvement/relationships. The Compensation Committee has discretion in evaluating the Chief Executive
Officer’s performance and may recommend to the full Board a discretionary increase or decrease to the Chief
Executive Officer’s final incentive award as the Compensation Committee believes is warranted.
34