Cincinnati Bell 2012 Annual Report Download - page 111
Download and view the complete annual report
Please find page 111 of the 2012 Cincinnati Bell annual report below. You can navigate through the pages in the report by either clicking on the pages listed below, or by using the keyword search tool below to find specific information within the annual report.-
 1
1 -
2
-
3
-
4
-
5
-
6
-
7
-
8
-
9
-
10
-
11
-
12
-
13
-
14
-
15
-
16
-
17
-
18
-
19
-
20
-
21
-
22
-
23
-
24
-
25
-
26
-
27
-
28
-
29
-
30
-
31
-
32
-
33
-
34
-
35
-
36
-
37
-
38
-
39
-
40
-
41
-
42
-
43
-
44
-
45
-
46
-
47
-
48
-
49
-
50
-
51
-
52
-
53
-
54
-
55
-
56
-
57
-
58
-
59
-
60
-
61
-
62
-
63
-
64
-
65
-
66
-
67
-
68
-
69
-
70
-
71
-
72
-
73
-
74
-
75
-
76
-
77
-
78
-
79
-
80
-
81
-
82
-
83
-
84
-
85
-
86
-
87
-
88
-
89
-
90
-
91
-
92
-
93
-
94
-
95
-
96
-
97
-
98
-
99
-
100
-
 101
101 -
 102
102 -
 103
103 -
 104
104 -
 105
105 -
 106
106 -
 107
107 -
 108
108 -
 109
109 -
 110
110 -
 111
111 -
 112
112 -
 113
113 -
 114
114 -
 115
115 -
 116
116 -
 117
117 -
 118
118 -
 119
119 -
 120
120 -
 121
121 -
122
-
123
-
124
-
125
-
126
-
127
-
128
-
129
-
130
-
131
-
132
-
133
-
134
-
135
-
136
-
137
-
138
-
139
-
140
-
141
-
142
-
143
-
144
-
145
-
146
-
147
-
148
-
149
-
150
-
151
-
152
-
153
-
154
-
155
-
156
-
157
-
158
-
159
-
160
-
161
-
162
-
163
-
164
-
165
-
166
-
167
-
168
-
169
-
170
-
171
-
172
-
173
-
174
-
175
-
176
-
177
-
178
-
179
-
180
-
181
-
182
-
183
-
184
-
185
-
186
-
187
-
188
-
189
-
190
-
191
-
192
-
193
-
194
-
195
-
196
-
197
-
198
-
199
-
200
-
201
-
202
-
203
-
204
-
205
-
206
-
207
-
208
-
209
-
210
-
211
-
212
-
213
-
214
-
215
-
216
 |
 |

Form 10-K Part II Cincinnati Bell Inc.
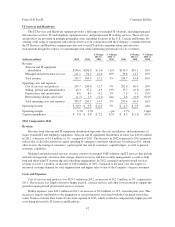
an increase of 17,500 subscribers, or 45%, compared to December 31, 2011. These revenue increases were
partially offset by lower DSL revenue as DSL subscribers decreased by 7% to 202,600 subscribers at the end of
2012.
Long distance and VoIP revenue was $113.9 million in 2012, an increase of $2.6 million, or 2%, compared
to 2011. This increase was primarily due to an increase in VoIP and audio conferencing services, driven by a
larger number of subscribers and higher usage. Partially offsetting this favorable trend was a decrease in long
distance residential revenue which declined by $3.6 million in 2012. As of December 31, 2012, long distance
subscriber lines totaled 417,900, a 7% decrease compared to the prior year. Long distance subscriber lines have
continued to decline as consumers opt to utilize wireless and VoIP services.
Entertainment revenue was $35.4 million in 2012, up $8.8 million, or 33%, compared to the prior year
driven primarily by the growth in Fioptics entertainment. Fioptics entertainment revenue grew by $9.1 million
over 2011, driven by a 39% increase in the number of Fioptics entertainment subscribers. As of December 31,
2012, the segment had 55,100 Fioptics entertainment subscribers. The Company continues to expand its Fioptics
service area as there is strong consumer demand for this service.
Other revenue was $18.9 million in 2012, a decrease of $3.5 million compared to the prior year. The
decrease was primarily related to the sale of the Company’s home security monitoring business in 2011.
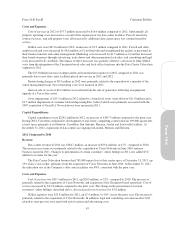
Costs and Expenses
Cost of services and products was $283.8 million in 2012, an increase of $13.8 million, or 5%, compared to
2011. This increase was largely attributable to a $14.6 million increase in costs, including contract services and
network-related costs, associated with the growth in Fioptics, audio conferencing and VoIP services. In addition,
operating taxes increased by $4.1 million compared to 2011 primarily due to higher regulatory rates and higher
franchise taxes resulting from increased Fioptics revenue. The impact of these cost increases was partially offset
by a $5.2 million reduction in payroll and rent expenses as a result of our cost reduction initiatives.
SG&A expenses were $125.6 million in 2012, a decrease of $1.1 million, or 1%, compared to the prior year.
This decrease was mainly driven by lower consulting and advertising costs, as well as the impact of our cost
reduction initiatives.
Depreciation and amortization was $106.0 million in 2012, reflecting an increase of $3.6 million compared
to the prior year. Assets placed in service in connection with the expansion of our Fioptics network drove the
higher depreciation expense.
Restructuring charges were $3.5 million in 2012 compared to $7.7 million in the prior year. The Company
continues to manage and reduce the legacy cost structure of this business. Employee separation costs amounted
to $3.2 million and $3.5 million in 2012 and 2011, respectively, while lease abandonment costs were $0.3 million
in 2012 and $2.5 million in 2011. Contract termination costs were $1.7 million in 2011 but none were incurred in
2012.
During 2011, curtailment losses of $4.2 million were recognized from the reduction of future pension
benefits for certain bargained employees, and a gain of $8.4 million was recognized from the sale of substantially
all of the assets associated with our home security monitoring business. During 2012, the segment recognized a
gain on sale of assets of $1.8 million primarily from the sale of copper cabling that was no longer in use.
Asset impairments of $0.5 million in 2012 relate primarily to the write-off of an out-of-territory fiber
network. The impairment losses in 2011 of $1.0 million were related to abandoned leasehold improvements on
vacated office space and the write-down to fair value of certain assets that were held for sale.
Capital Expenditures
Capital expenditures are incurred to maintain the wireline network, expand the Company’s Fioptics product
suite, and upgrade its DSL network. Capital expenditures were $114.2 million in 2012, an increase of $1.6
million compared to 2011. As of December 31, 2012, the Company’s Fioptics service passed 205,000 homes and
businesses, representing approximately 26% of the Greater Cincinnati market. The Company intends to expand
its Fioptics footprint over the next few years.
37
Form 10-K