Cincinnati Bell 2012 Annual Report Download - page 40
Download and view the complete annual report
Please find page 40 of the 2012 Cincinnati Bell annual report below. You can navigate through the pages in the report by either clicking on the pages listed below, or by using the keyword search tool below to find specific information within the annual report.-
 1
1 -
2
-
3
-
4
-
5
-
6
-
7
-
8
-
9
-
10
-
11
-
12
-
13
-
14
-
15
-
16
-
17
-
18
-
19
-
20
-
21
-
22
-
23
-
24
-
25
-
26
-
27
-
28
-
29
-
 30
30 -
 31
31 -
 32
32 -
 33
33 -
 34
34 -
 35
35 -
 36
36 -
 37
37 -
 38
38 -
 39
39 -
 40
40 -
 41
41 -
 42
42 -
 43
43 -
 44
44 -
 45
45 -
 46
46 -
 47
47 -
 48
48 -
 49
49 -
 50
50 -
51
-
52
-
53
-
54
-
55
-
56
-
57
-
58
-
59
-
60
-
61
-
62
-
63
-
64
-
65
-
66
-
67
-
68
-
69
-
70
-
71
-
72
-
73
-
74
-
75
-
76
-
77
-
78
-
79
-
80
-
81
-
82
-
83
-
84
-
85
-
86
-
87
-
88
-
89
-
90
-
91
-
92
-
93
-
94
-
95
-
96
-
97
-
98
-
99
-
100
-
101
-
102
-
103
-
104
-
105
-
106
-
107
-
108
-
109
-
110
-
111
-
112
-
113
-
114
-
115
-
116
-
117
-
118
-
119
-
120
-
121
-
122
-
123
-
124
-
125
-
126
-
127
-
128
-
129
-
130
-
131
-
132
-
133
-
134
-
135
-
136
-
137
-
138
-
139
-
140
-
141
-
142
-
143
-
144
-
145
-
146
-
147
-
148
-
149
-
150
-
151
-
152
-
153
-
154
-
155
-
156
-
157
-
158
-
159
-
160
-
161
-
162
-
163
-
164
-
165
-
166
-
167
-
168
-
169
-
170
-
171
-
172
-
173
-
174
-
175
-
176
-
177
-
178
-
179
-
180
-
181
-
182
-
183
-
184
-
185
-
186
-
187
-
188
-
189
-
190
-
191
-
192
-
193
-
194
-
195
-
196
-
197
-
198
-
199
-
200
-
201
-
202
-
203
-
204
-
205
-
206
-
207
-
208
-
209
-
210
-
211
-
212
-
213
-
214
-
215
-
216
 |
 |

Executive Summary
Financial Results
In 2012, we continued to execute on our plan to expand our growth products, comprised of our Fioptics,
strategic enterprise data and VoIP, and data center offerings. The additional revenue generated from these growth
products more than offset the lower revenue from declining access line and wireless subscribers, and, as a result,
the Company’s total revenue in 2012 increased by 1% year-over-year to approximately $1.5 billion, its highest
level in 10 years. Operating income in 2012 was $270 million, up 4% compared to the prior year, driven
primarily by a $50.3 million goodwill write-down in 2011, partially offset by $14.2 million of asset impairments
in 2012. Adjusted EBITDA was $535 million in 2012, down from $545 million in 2011. Adjusted EBITDA for
2012 included an $8 million mark-to-market charge on incentive awards indexed to the Company’s stock price
resulting from the increase in the Company’s stock price in 2012.
On January 24, 2013, we completed the initial public offering (“IPO”) of CyrusOne, which owns and
operates our former data center colocation business. CyrusOne conducts its data center business through
CyrusOne LP, an operating partnership. After the IPO, we own approximately 1.9 million shares, or 8.6%, of
CyrusOne’s common stock and are a limited partner in CyrusOne LP, owning approximately 42.6 million, or
66%, of its partnership units. Commencing January 17, 2014, the Company may redeem its CyrusOne LP units
for either common stock of CyrusOne on a one-to-one basis or cash, at the option of CyrusOne, based on the fair
value of a share of CyrusOne common stock. Although we effectively own approximately 69% of the economic
interests of CyrusOne through our ownership of its common stock and partnership units of CyrusOne LP, we no
longer control its operations.
See “Management’s Discussion and Analysis of Financial Conditions and Results of Operations” in the
Company’s Annual Report on Form 10-K for further details on the Company’s 2012 financial results.
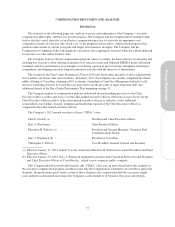
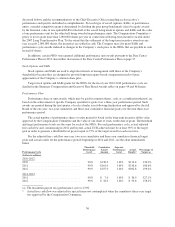
The Company’s executive compensation program ties a significant portion of an executive’s annual
compensation to the Company’s achievement of performance-based financial targets. The key financial measures
utilized to assess achievement of annual goals are revenue and Adjusted EBITDA. The key financial measures
utilized to assess achievement of long-term goals are Free Cash Flow and, beginning in 2012, Unlevered Cash
Return on Assets. The table below highlights the year-over-year comparison of some of these performance
measures:
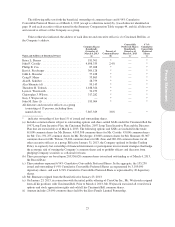
Performance Measure Fiscal Year 2012 Fiscal Year 2011 % Change
2012 Original
Guidance
Revenue ......................... $ 1.47 B $1.46 B 1% $1.5 B
Adjusted EBITDA (a) ............... $ 535M $545M (2)% $530 M +/-2%
Free Cash Flow (a) ................. $(154) M $ 11 M n/m —
Unlevered Cash Return on Assets (a) . . . 16% N/A — —
(a) See Annex A for a reconciliation of Adjusted EBITDA, Free Cash Flow and Unlevered Cash Return on
Assets to the nearest GAAP based financial measures.
In 2012, the Compensation Committee approved Unlevered Cash Return on Assets (“UCR”) as the
performance measure to be utilized in assessing achievement of long-term incentive goals, rather than Free Cash
Flow. Unlevered Cash Return on Assets is defined as operating cash flow excluding interest payments as a
percentage of average total assets. Free Cash Flow had become a less meaningful performance measure as the
Company invested significant capital in both its Fioptics and its data center business, resulting in negative free
cash flow in 2012.
Although shareholders and proxy advisory companies tend to focus on “total shareholder return” (“TSR”) as
a major factor in judging a Company’s performance, we have historically adopted other measures of the
Company’s financial performance on the theory that using TSR as a financial metric may encourage a focus on
short-term results. For example, at a time when its core telecommunications business faced intense competitive
challenges, the Company used its capital to seize the opportunity to become the premier data center colocation
provider to Fortune 1000 companies rather than pay dividends to its shareholders, which could be detrimental to
the Company’s long-term strategic opportunities. In addition, as a result of the scope of the Company’s historical
28