Cincinnati Bell 2012 Annual Report Download - page 175
Download and view the complete annual report
Please find page 175 of the 2012 Cincinnati Bell annual report below. You can navigate through the pages in the report by either clicking on the pages listed below, or by using the keyword search tool below to find specific information within the annual report.-
 1
1 -
2
-
3
-
4
-
5
-
6
-
7
-
8
-
9
-
10
-
11
-
12
-
13
-
14
-
15
-
16
-
17
-
18
-
19
-
20
-
21
-
22
-
23
-
24
-
25
-
26
-
27
-
28
-
29
-
30
-
31
-
32
-
33
-
34
-
35
-
36
-
37
-
38
-
39
-
40
-
41
-
42
-
43
-
44
-
45
-
46
-
47
-
48
-
49
-
50
-
51
-
52
-
53
-
54
-
55
-
56
-
57
-
58
-
59
-
60
-
61
-
62
-
63
-
64
-
65
-
66
-
67
-
68
-
69
-
70
-
71
-
72
-
73
-
74
-
75
-
76
-
77
-
78
-
79
-
80
-
81
-
82
-
83
-
84
-
85
-
86
-
87
-
88
-
89
-
90
-
91
-
92
-
93
-
94
-
95
-
96
-
97
-
98
-
99
-
100
-
101
-
102
-
103
-
104
-
105
-
106
-
107
-
108
-
109
-
110
-
111
-
112
-
113
-
114
-
115
-
116
-
117
-
118
-
119
-
120
-
121
-
122
-
123
-
124
-
125
-
126
-
127
-
128
-
129
-
130
-
131
-
132
-
133
-
134
-
135
-
136
-
137
-
138
-
139
-
140
-
141
-
142
-
143
-
144
-
145
-
146
-
147
-
148
-
149
-
150
-
151
-
152
-
153
-
154
-
155
-
156
-
157
-
158
-
159
-
160
-
161
-
162
-
163
-
164
-
 165
165 -
 166
166 -
 167
167 -
 168
168 -
 169
169 -
 170
170 -
 171
171 -
 172
172 -
 173
173 -
 174
174 -
 175
175 -
 176
176 -
 177
177 -
 178
178 -
 179
179 -
 180
180 -
 181
181 -
 182
182 -
 183
183 -
 184
184 -
 185
185 -
186
-
187
-
188
-
189
-
190
-
191
-
192
-
193
-
194
-
195
-
196
-
197
-
198
-
199
-
200
-
201
-
202
-
203
-
204
-
205
-
206
-
207
-
208
-
209
-
210
-
211
-
212
-
213
-
214
-
215
-
216
 |
 |

Form 10-K Part II Cincinnati Bell Inc.
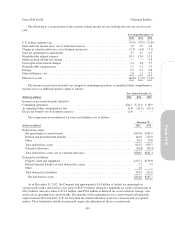
During 2012, the following assets were remeasured at fair value in connection with impairment tests:
Fair Value Measurements Using
(dollars in millions)
Year Ended
December 31,
2012
Quoted Prices
in Active
Markets for
Identical Assets
(Level 1)
Significant
Other
Observable
Inputs
(Level 2)
Significant
Unobservable
Inputs
(Level 3)
Impairment
Losses
Customer relationship intangible ......... $2.8 $ — $ — $2.8 $ (1.5)
Property:
Leasehold improvements ........... 2.4 — — 2.4 (11.8)
Network equipment ............... 0.4 — — 0.4 (0.5)
Other ........................... — — — — (0.4)
Impairment of assets .................. $(14.2)
In 2012, the customer relationship intangible obtained in the GramTel acquisition was deemed impaired.
The fair value of this asset was estimated at $2.8 million, resulting in an impairment loss of $1.5 million. The fair
value of this asset was estimated by management with the assistance of a third-party valuation specialist.
Management estimated the fair value using the income approach, which discounted the expected future earnings
attributable to the acquired customer contracts, and included estimates of future expenses, capital expenditures
and a discount rate of 12%. This fair value measurement is considered a Level 3 measurement due to the
significance of its unobservable inputs.
In addition, certain leasehold improvements at data centers acquired in the GramTel acquisition were
deemed impaired. Prior to recognizing the impairment, these assets had a net book value of $14.2 million as of
June, 30, 2012. The fair value of the assets was written down to the estimated fair value of $2.4 million, resulting
in an impairment loss of $11.8 million. The fair value of these assets was estimated by management with the
assistance of a third-party valuation specialist. Management estimated the fair value using an income approach.
Projected discounted cash flows utilized under the income approach included estimates regarding future revenues
and expenses, projected capital expenditures and a discount rate of 12%. This fair value measurement is
considered a Level 3 measurement due to the significance of its unobservable inputs.
In 2012, property associated with an out-of-territory fiber network was deemed impaired. The fair value of
this asset was estimated at $0.4 million, resulting in an impairment loss of $0.5 million. Management estimated
the fair value using an income approach. Projected discounted cash flows utilized under the income approach
included estimates regarding future revenues and expenses, projected capital expenditures and a discount rate of
12%. This fair value measurement is considered a Level 3 measurement due to the significance of its
unobservable inputs. In addition, properties associated with abandoned assets having no resale market were
deemed impaired, resulting in an impairment loss of $0.4 million.
During 2011, the following assets were remeasured at fair value in connection with impairment tests:
Fair Value Measurements Using
(dollars in millions)
Year Ended
December 31,
2011
Quoted Prices
in Active
Markets for
Identical Assets
(Level 1)
Significant
Other
Observable
Inputs
(Level 2)
Significant
Unobservable
Inputs
(Level 3)
Impairment
Losses
Property ............................ $— $— $— $— $ (2.1)
Goodwill ............................ — — — — (50.3)
Impairment of goodwill and other assets . . . $(52.4)
In 2011, certain property with a carrying amount of $2.1 million was written down to its estimated fair value
of zero. Fair value was determined to be zero due to the absence of a market to sell these assets. This fair value
measurement is considered a Level 3 measurement due to the significance of its unobservable inputs.
101
Form 10-K