Cincinnati Bell 2012 Annual Report Download - page 119
Download and view the complete annual report
Please find page 119 of the 2012 Cincinnati Bell annual report below. You can navigate through the pages in the report by either clicking on the pages listed below, or by using the keyword search tool below to find specific information within the annual report.-
 1
1 -
2
-
3
-
4
-
5
-
6
-
7
-
8
-
9
-
10
-
11
-
12
-
13
-
14
-
15
-
16
-
17
-
18
-
19
-
20
-
21
-
22
-
23
-
24
-
25
-
26
-
27
-
28
-
29
-
30
-
31
-
32
-
33
-
34
-
35
-
36
-
37
-
38
-
39
-
40
-
41
-
42
-
43
-
44
-
45
-
46
-
47
-
48
-
49
-
50
-
51
-
52
-
53
-
54
-
55
-
56
-
57
-
58
-
59
-
60
-
61
-
62
-
63
-
64
-
65
-
66
-
67
-
68
-
69
-
70
-
71
-
72
-
73
-
74
-
75
-
76
-
77
-
78
-
79
-
80
-
81
-
82
-
83
-
84
-
85
-
86
-
87
-
88
-
89
-
90
-
91
-
92
-
93
-
94
-
95
-
96
-
97
-
98
-
99
-
100
-
101
-
102
-
103
-
104
-
105
-
106
-
107
-
108
-
 109
109 -
 110
110 -
 111
111 -
 112
112 -
 113
113 -
 114
114 -
 115
115 -
 116
116 -
 117
117 -
 118
118 -
 119
119 -
 120
120 -
 121
121 -
 122
122 -
 123
123 -
 124
124 -
 125
125 -
 126
126 -
 127
127 -
 128
128 -
 129
129 -
130
-
131
-
132
-
133
-
134
-
135
-
136
-
137
-
138
-
139
-
140
-
141
-
142
-
143
-
144
-
145
-
146
-
147
-
148
-
149
-
150
-
151
-
152
-
153
-
154
-
155
-
156
-
157
-
158
-
159
-
160
-
161
-
162
-
163
-
164
-
165
-
166
-
167
-
168
-
169
-
170
-
171
-
172
-
173
-
174
-
175
-
176
-
177
-
178
-
179
-
180
-
181
-
182
-
183
-
184
-
185
-
186
-
187
-
188
-
189
-
190
-
191
-
192
-
193
-
194
-
195
-
196
-
197
-
198
-
199
-
200
-
201
-
202
-
203
-
204
-
205
-
206
-
207
-
208
-
209
-
210
-
211
-
212
-
213
-
214
-
215
-
216
 |
 |

Form 10-K Part II Cincinnati Bell Inc.
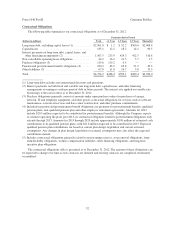
Costs and Expenses
Cost of services in 2012 of $75.7 million increased by $16.0 million compared to 2011. Substantially all
property operating costs increased as a result of the expansion of our data center facilities. Payroll, electricity,
contract services, rent and property taxes all increased as additional data center space was commissioned for
service.
SG&A costs were $31.0 million in 2012, an increase of $7.2 million compared to 2011. Payroll and other
employee-related costs increased by $8.6 million as CyrusOne built and strengthened the quality of personnel in
their finance function and senior management. Marketing costs increased by $1.5 million as CyrusOne increased
their brand awareness through advertising, trade shows and other promotional activities, and consulting and legal
costs increased by $1.4 million. The impact of these increases was partially offset by a decrease in other SG&A
costs from the integration of the Cincinnati-based sales and back office functions into the Data Center Colocation
segment in 2012.
The $15.8 million increase in depreciation and amortization expense for 2012 compared to 2011 was
primarily due to new data center facilities placed into service in 2011 and 2012.
Restructuring charges of $0.5 million in 2012 were primarily related to the separation of a member of the
senior management team. No restructuring costs were incurred in 2011.
Gain on sale of assets of $0.2 million was realized from the sale of generators following an equipment
upgrade at a Texas data center.
Asset impairments of $13.3 million in 2012 related to a long-lived assets write-down of $11.8 million and a
$1.5 million impairment of customer relationship intangibles, both of which were primarily associated with the
2007 acquisition of GramTel. No such losses were incurred in 2011.
Capital Expenditures
Capital expenditures were $228.2 million in 2012, an increase of $109.7 million compared to the prior year.
During 2012, CyrusOne continued its development of real estate, completing construction on 199,000 square feet
of new space primarily at its Houston, Carrollton, San Antonio, Phoenix, Austin and Lewisville facilities. At
December 31, 2012, expansions of data centers are ongoing in London, Phoenix and Houston.
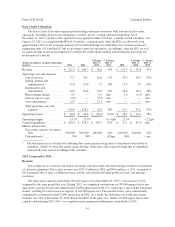
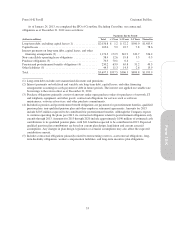
2011 Compared to 2010
Revenue
Data center revenue in 2011 was $184.7 million, an increase of $59.4 million, or 47%, compared to 2010.
The increase in revenue was primarily related to the acquisition of Cyrus Networks in June 2010 and new
business earned in 2011. Changes to presentation of certain customers’ utility billings in 2011 also added $7.6
million to revenue for the year.
The Data Center Colocation business had 763,000 square feet of data center space at December 31, 2011, up
19% from a year earlier, primarily from the acquisition of Cyrus Networks in June 2010. At December 31, 2011
the utilization rate of the Company’s data center facilities was 88%, consistent with the prior year.
Costs and Expenses
Cost of services was $59.7 million for 2011, up $20.5 million, or 52%, compared to 2010. The increase is
primarily related to the acquisition of Cyrus Networks and expansion of the Cincinnati-based operations. Cost of
services increased by $13.4 million compared to the prior year. The change in the presentation of certain
customers’ utility billings, described above, also increased cost of services by $7.6 million.
SG&A expenses were $23.8 million for 2011, up $7.9 million, or 50%, versus the prior year. The increase is
primarily related to the acquisition of Cyrus Networks. In addition, legal and consulting costs increased in 2011
related to start-up costs associated with new locations and advertising costs.
45
Form 10-K