Cincinnati Bell 2012 Annual Report Download - page 152
Download and view the complete annual report
Please find page 152 of the 2012 Cincinnati Bell annual report below. You can navigate through the pages in the report by either clicking on the pages listed below, or by using the keyword search tool below to find specific information within the annual report.-
 1
1 -
2
-
3
-
4
-
5
-
6
-
7
-
8
-
9
-
10
-
11
-
12
-
13
-
14
-
15
-
16
-
17
-
18
-
19
-
20
-
21
-
22
-
23
-
24
-
25
-
26
-
27
-
28
-
29
-
30
-
31
-
32
-
33
-
34
-
35
-
36
-
37
-
38
-
39
-
40
-
41
-
42
-
43
-
44
-
45
-
46
-
47
-
48
-
49
-
50
-
51
-
52
-
53
-
54
-
55
-
56
-
57
-
58
-
59
-
60
-
61
-
62
-
63
-
64
-
65
-
66
-
67
-
68
-
69
-
70
-
71
-
72
-
73
-
74
-
75
-
76
-
77
-
78
-
79
-
80
-
81
-
82
-
83
-
84
-
85
-
86
-
87
-
88
-
89
-
90
-
91
-
92
-
93
-
94
-
95
-
96
-
97
-
98
-
99
-
100
-
101
-
102
-
103
-
104
-
105
-
106
-
107
-
108
-
109
-
110
-
111
-
112
-
113
-
114
-
115
-
116
-
117
-
118
-
119
-
120
-
121
-
122
-
123
-
124
-
125
-
126
-
127
-
128
-
129
-
130
-
131
-
132
-
133
-
134
-
135
-
136
-
137
-
138
-
139
-
140
-
141
-
 142
142 -
 143
143 -
 144
144 -
 145
145 -
 146
146 -
 147
147 -
 148
148 -
 149
149 -
 150
150 -
 151
151 -
 152
152 -
 153
153 -
 154
154 -
 155
155 -
 156
156 -
 157
157 -
 158
158 -
 159
159 -
 160
160 -
 161
161 -
 162
162 -
163
-
164
-
165
-
166
-
167
-
168
-
169
-
170
-
171
-
172
-
173
-
174
-
175
-
176
-
177
-
178
-
179
-
180
-
181
-
182
-
183
-
184
-
185
-
186
-
187
-
188
-
189
-
190
-
191
-
192
-
193
-
194
-
195
-
196
-
197
-
198
-
199
-
200
-
201
-
202
-
203
-
204
-
205
-
206
-
207
-
208
-
209
-
210
-
211
-
212
-
213
-
214
-
215
-
216
 |
 |

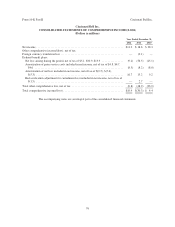
Cincinnati Bell Inc.
CONSOLIDATED STATEMENTS OF CASH FLOWS
(Dollars in millions)
Year Ended December 31,
2012 2011 2010
Cash flows from operating activities
Net income ................................................................ $ 11.2 $ 18.6 $ 28.3
Adjustments to reconcile net income to net cash provided by operating activities:
Depreciation and amortization ............................................... 217.4 199.5 179.5
Loss on extinguishment of debt .............................................. 13.6 — 46.5
Gain on sale of assets ...................................................... (1.6) (8.4) —
Impairment of goodwill and other assets ....................................... 14.2 52.4 —
Provision for loss on receivables ............................................. 13.9 13.9 15.2
Noncash portion of interest expense .......................................... 7.8 7.7 8.0
Deferred income tax expense, including valuation allowance change ................ 21.6 24.9 38.2
Pension and other postretirement benefits in excess of expense ..................... (28.4) (19.5) (10.7)
Stock-based compensation .................................................. 5.2 4.1 3.3
Excess tax benefit for share based payments .................................... (2.4) — —
Other, net ............................................................... (1.4) (3.7) (3.5)
Changes in operating assets and liabilities, net of effects of acquisitions:
Increase in receivables ..................................................... (33.6) (10.6) (26.7)
(Increase) decrease in inventory, materials, supplies, prepaid expenses and other current
assets ................................................................ (14.5) (5.9) 22.2
(Decrease) increase in accounts payable ....................................... (6.9) 19.2 4.6
(Decrease) increase in accrued and other current liabilities ........................ (10.0) (0.5) 4.0
Decrease (increase) in other noncurrent assets .................................. 4.6 1.1 (5.4)
Increase (decrease) in other noncurrent liabilities ................................ 2.0 (2.9) (3.5)
Net cash provided by operating activities ........................................ 212.7 289.9 300.0
Cash flows from investing activities
Capital expenditures ...................................................... (367.2) (255.5) (149.7)
Acquisitions of businesses, net of cash acquired ................................. — — (526.7)
Proceeds from sale of assets ................................................ 1.6 11.5 —
Increase in restricted cash .................................................. (11.1) — —
Release of restricted cash ................................................... 4.9 — —
Other, net ............................................................... — (0.7) 0.9
Net cash used in investing activities ............................................ (371.8) (244.7) (675.5)
Cash flows from financing activities
Proceeds from issuance of long-term debt ...................................... 525.0 — 2,134.3
Increase (decrease) in corporate credit and receivables facilities with initial maturities
less than 90 days ....................................................... 52.0 0.4 (85.9)
Repayment of debt ........................................................ (442.4) (11.5) (1,554.5)
Debt issuance costs ....................................................... (20.9) (0.8) (42.6)
Dividends paid on preferred stock ............................................ (10.4) (10.4) (10.4)
CyrusOne stock issuance costs .............................................. (5.7) — —
Common stock repurchase .................................................. (0.3) (10.4) (10.0)
Proceeds from exercise of options and warrants ................................. 12.1 0.4 0.5
Excess tax benefit for share based payments .................................... 2.4 — —
Financing obligations and other, net .......................................... (2.8) (16.5) (1.6)
Net cash provided by (used in) financing activities ................................. 109.0 (48.8) 429.8
Net (decrease) increase in cash and cash equivalents ............................... (50.1) (3.6) 54.3
Cash and cash equivalents at beginning of year ................................... 73.7 77.3 23.0
Cash and cash equivalents at end of year ........................................ $ 23.6 $ 73.7 $ 77.3
The accompanying notes are an integral part of the consolidated financial statements.
78
Form 10-K Part II Cincinnati Bell Inc.