Cincinnati Bell 2012 Annual Report Download - page 107
Download and view the complete annual report
Please find page 107 of the 2012 Cincinnati Bell annual report below. You can navigate through the pages in the report by either clicking on the pages listed below, or by using the keyword search tool below to find specific information within the annual report.-
 1
1 -
2
-
3
-
4
-
5
-
6
-
7
-
8
-
9
-
10
-
11
-
12
-
13
-
14
-
15
-
16
-
17
-
18
-
19
-
20
-
21
-
22
-
23
-
24
-
25
-
26
-
27
-
28
-
29
-
30
-
31
-
32
-
33
-
34
-
35
-
36
-
37
-
38
-
39
-
40
-
41
-
42
-
43
-
44
-
45
-
46
-
47
-
48
-
49
-
50
-
51
-
52
-
53
-
54
-
55
-
56
-
57
-
58
-
59
-
60
-
61
-
62
-
63
-
64
-
65
-
66
-
67
-
68
-
69
-
70
-
71
-
72
-
73
-
74
-
75
-
76
-
77
-
78
-
79
-
80
-
81
-
82
-
83
-
84
-
85
-
86
-
87
-
88
-
89
-
90
-
91
-
92
-
93
-
94
-
95
-
96
-
 97
97 -
 98
98 -
 99
99 -
 100
100 -
 101
101 -
 102
102 -
 103
103 -
 104
104 -
 105
105 -
 106
106 -
 107
107 -
 108
108 -
 109
109 -
 110
110 -
 111
111 -
 112
112 -
 113
113 -
 114
114 -
 115
115 -
 116
116 -
 117
117 -
118
-
119
-
120
-
121
-
122
-
123
-
124
-
125
-
126
-
127
-
128
-
129
-
130
-
131
-
132
-
133
-
134
-
135
-
136
-
137
-
138
-
139
-
140
-
141
-
142
-
143
-
144
-
145
-
146
-
147
-
148
-
149
-
150
-
151
-
152
-
153
-
154
-
155
-
156
-
157
-
158
-
159
-
160
-
161
-
162
-
163
-
164
-
165
-
166
-
167
-
168
-
169
-
170
-
171
-
172
-
173
-
174
-
175
-
176
-
177
-
178
-
179
-
180
-
181
-
182
-
183
-
184
-
185
-
186
-
187
-
188
-
189
-
190
-
191
-
192
-
193
-
194
-
195
-
196
-
197
-
198
-
199
-
200
-
201
-
202
-
203
-
204
-
205
-
206
-
207
-
208
-
209
-
210
-
211
-
212
-
213
-
214
-
215
-
216
 |
 |

Form 10-K Part II Cincinnati Bell Inc.
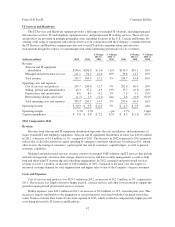
by $7.0 million from 2011 driven largely by higher regulatory rates and higher franchise taxes resulting from
increased Fioptics revenue and higher property taxes from our increased data center footprint. Payroll and
employee-related costs also increased by $4.0 million compared to 2011, due primarily to the addition of new
personnel to support growth in data center operations and the higher demand for professional and managed IT
services.
Cost of products sold was $204.7 million in 2012 compared to $213.0 million in the prior year, a decrease of
$8.3 million, or 4%, that was mainly driven by lower sales of wireless handsets and IT equipment, as discussed
above.
Selling, general and administrative (“SG&A”) expenses were $269.5 million in 2012, an increase of $6.4
million, or 2%, compared to 2011. The increase was largely due to stock compensation mark-to-market expense
of $7.9 million, up from $0.6 million in 2011, primarily associated with an 81% increase in the Company’s stock
price during 2012. The Company grants stock-based compensation, some of which are cash-payment awards
indexed to the Company’s stock price.
Depreciation and amortization was $217.4 million in 2012, an increase of $17.9 million compared to the
prior year. The higher depreciation and amortization was primarily the result of new assets placed in service for
our data center facilities.
Restructuring charges were $3.4 million in 2012 compared to $12.2 million in the prior year. In 2012,
restructuring charges represented severance associated with employee separations and lease abandonments. In
2011, restructuring costs were incurred for employee separations, lease abandonments and contract terminations.
Such costs were lower in 2012 as we completed certain restructuring activities begun in the prior year.
In 2011, the Company ratified a new labor agreement which curtails future pension service credits for
certain employees. As a result of this event, the bargained employees’ pension plan was remeasured and a
curtailment loss of $4.2 million was recognized. In 2012, no events occurred to trigger a remeasurement of our
pension plans or curtailment loss.
Gain on sale or disposal of assets was $1.6 million in 2012, down from $8.4 million in 2011. In 2012, a gain
was realized primarily from the sale of copper cables no longer utilized in our Wireline network. In 2011, a gain
of $8.4 million was recognized as a result of selling substantially all of the assets associated with our home
security monitoring business.
Asset impairment losses amounted to $14.2 million in 2012 compared to $52.4 million in 2011. In 2012,
impairment losses were largely driven by $13.3 million of impairment losses in the Data Center Colocation
segment on a customer relationship intangible asset and property and equipment that was primarily associated
with our 2007 acquisition of GramTel. During 2011, the Company recognized goodwill impairment losses
totaling $50.3 million that were related to the Wireless segment.
Transaction costs of $6.3 million were incurred in 2012, up from $2.6 million incurred in 2011. In 2012,
these costs represented legal and consulting costs incurred to restructure our legal entities in preparation for the
proposed IPO of the common stock of CyrusOne and to prepare CyrusOne to be a real estate investment trust. In
2011, transaction costs represented legal and consulting costs to investigate acquisition opportunities.
Interest expense was $218.9 million in 2012 compared to $215.0 million in 2011, an increase of $3.9
million. The increase was largely due to the issuance by CyrusOne LP and CyrusOne Finance Corp of $525
million of 6 3/8% Senior Notes due 2022 in the fourth quarter of 2012 which increased interest expense by $3.8
million, higher interest costs of $2.4 million from lease obligations, as well as $0.8 million of lower capitalized
interest. The impact of these increases was partially offset by lower interest expense from the redemptions of the
7% Senior Notes due 2015, certain CBT Notes and a portion of the 8 3/8% Senior Notes due 2020.
Loss on extinguishment of debt of $13.6 million was a result of the debt repayment and partial redemptions
made during the fourth quarter of 2012 as discussed in the preceding paragraph. No debt extinguishment
occurred in 2011.
33
Form 10-K