Cincinnati Bell 2012 Annual Report Download - page 148
Download and view the complete annual report
Please find page 148 of the 2012 Cincinnati Bell annual report below. You can navigate through the pages in the report by either clicking on the pages listed below, or by using the keyword search tool below to find specific information within the annual report.-
 1
1 -
2
-
3
-
4
-
5
-
6
-
7
-
8
-
9
-
10
-
11
-
12
-
13
-
14
-
15
-
16
-
17
-
18
-
19
-
20
-
21
-
22
-
23
-
24
-
25
-
26
-
27
-
28
-
29
-
30
-
31
-
32
-
33
-
34
-
35
-
36
-
37
-
38
-
39
-
40
-
41
-
42
-
43
-
44
-
45
-
46
-
47
-
48
-
49
-
50
-
51
-
52
-
53
-
54
-
55
-
56
-
57
-
58
-
59
-
60
-
61
-
62
-
63
-
64
-
65
-
66
-
67
-
68
-
69
-
70
-
71
-
72
-
73
-
74
-
75
-
76
-
77
-
78
-
79
-
80
-
81
-
82
-
83
-
84
-
85
-
86
-
87
-
88
-
89
-
90
-
91
-
92
-
93
-
94
-
95
-
96
-
97
-
98
-
99
-
100
-
101
-
102
-
103
-
104
-
105
-
106
-
107
-
108
-
109
-
110
-
111
-
112
-
113
-
114
-
115
-
116
-
117
-
118
-
119
-
120
-
121
-
122
-
123
-
124
-
125
-
126
-
127
-
128
-
129
-
130
-
131
-
132
-
133
-
134
-
135
-
136
-
137
-
 138
138 -
 139
139 -
 140
140 -
 141
141 -
 142
142 -
 143
143 -
 144
144 -
 145
145 -
 146
146 -
 147
147 -
 148
148 -
 149
149 -
 150
150 -
 151
151 -
 152
152 -
 153
153 -
 154
154 -
 155
155 -
 156
156 -
 157
157 -
 158
158 -
159
-
160
-
161
-
162
-
163
-
164
-
165
-
166
-
167
-
168
-
169
-
170
-
171
-
172
-
173
-
174
-
175
-
176
-
177
-
178
-
179
-
180
-
181
-
182
-
183
-
184
-
185
-
186
-
187
-
188
-
189
-
190
-
191
-
192
-
193
-
194
-
195
-
196
-
197
-
198
-
199
-
200
-
201
-
202
-
203
-
204
-
205
-
206
-
207
-
208
-
209
-
210
-
211
-
212
-
213
-
214
-
215
-
216
 |
 |

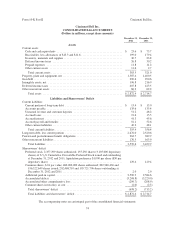
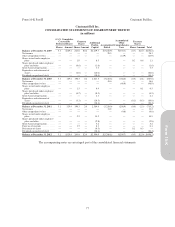
Cincinnati Bell Inc.
CONSOLIDATED BALANCE SHEETS
(Dollars in millions, except share amounts)
December 31,
2012
December 31,
2011
Assets
Current assets
Cash and cash equivalents .............................................. $ 23.6 $ 73.7
Receivables, less allowances of $13.3 and $11.6 ............................. 199.0 179.4
Inventory, materials and supplies ......................................... 30.7 23.8
Deferred income taxes ................................................. 26.8 30.2
Prepaid expenses ..................................................... 11.8 11.2
Other current assets ................................................... 11.6 2.7
Total current assets .................................................. 303.5 321.0
Property, plant and equipment, net .......................................... 1,587.4 1,400.5
Goodwill .............................................................. 290.6 290.6
Intangible assets, net .................................................... 196.8 216.9
Deferred income taxes ................................................... 407.8 423.5
Other noncurrent assets .................................................. 86.3 62.2
Total assets ........................................................ $2,872.4 $ 2,714.7
Liabilities and Shareowners’ Deficit
Current liabilities
Current portion of long-term debt ........................................ $ 13.4 $ 13.0
Accounts payable ..................................................... 135.6 133.4
Unearned revenue and customer deposits .................................. 51.2 48.2
Accrued taxes ........................................................ 21.6 15.5
Accrued interest ...................................................... 41.3 45.6
Accrued payroll and benefits ............................................ 52.1 52.6
Other current liabilities ................................................. 40.2 48.1
Total current liabilities ............................................... 355.4 356.4
Long-term debt, less current portion ........................................ 2,676.0 2,520.6
Pension and postretirement benefit obligations ................................ 362.7 389.9
Other noncurrent liabilities ................................................ 176.5 163.0
Total liabilities ..................................................... 3,570.6 3,429.9
Shareowners’ deficit
Preferred stock, 2,357,299 shares authorized; 155,250 shares (3,105,000 depositary
shares) of 6 3/4% Cumulative Convertible Preferred Stock issued and outstanding
at December 31, 2012 and 2011; liquidation preference $1,000 per share ($50 per
depositary share) ................................................... 129.4 129.4
Common shares, $.01 par value; 480,000,000 shares authorized; 202,960,430 and
196,322,649 shares issued; 202,468,710 and 195,721,796 shares outstanding at
December 31, 2012 and 2011 .......................................... 2.0 2.0
Additional paid-in capital ............................................... 2,590.9 2,584.6
Accumulated deficit ................................................... (3,208.8) (3,220.0)
Accumulated other comprehensive loss .................................... (209.7) (208.9)
Common shares in treasury, at cost ....................................... (2.0) (2.3)
Total shareowners’ deficit ............................................ (698.2) (715.2)
Total liabilities and shareowners’ deficit ................................. $2,872.4 $ 2,714.7
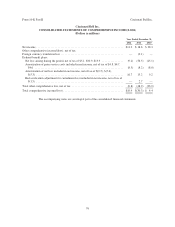
The accompanying notes are an integral part of the consolidated financial statements.
74
Form 10-K Part II Cincinnati Bell Inc.