Cincinnati Bell 2012 Annual Report Download - page 53
Download and view the complete annual report
Please find page 53 of the 2012 Cincinnati Bell annual report below. You can navigate through the pages in the report by either clicking on the pages listed below, or by using the keyword search tool below to find specific information within the annual report.-
 1
1 -
2
-
3
-
4
-
5
-
6
-
7
-
8
-
9
-
10
-
11
-
12
-
13
-
14
-
15
-
16
-
17
-
18
-
19
-
20
-
21
-
22
-
23
-
24
-
25
-
26
-
27
-
28
-
29
-
30
-
31
-
32
-
33
-
34
-
35
-
36
-
37
-
38
-
39
-
40
-
41
-
42
-
 43
43 -
 44
44 -
 45
45 -
 46
46 -
 47
47 -
 48
48 -
 49
49 -
 50
50 -
 51
51 -
 52
52 -
 53
53 -
 54
54 -
 55
55 -
 56
56 -
 57
57 -
 58
58 -
 59
59 -
 60
60 -
 61
61 -
 62
62 -
 63
63 -
64
-
65
-
66
-
67
-
68
-
69
-
70
-
71
-
72
-
73
-
74
-
75
-
76
-
77
-
78
-
79
-
80
-
81
-
82
-
83
-
84
-
85
-
86
-
87
-
88
-
89
-
90
-
91
-
92
-
93
-
94
-
95
-
96
-
97
-
98
-
99
-
100
-
101
-
102
-
103
-
104
-
105
-
106
-
107
-
108
-
109
-
110
-
111
-
112
-
113
-
114
-
115
-
116
-
117
-
118
-
119
-
120
-
121
-
122
-
123
-
124
-
125
-
126
-
127
-
128
-
129
-
130
-
131
-
132
-
133
-
134
-
135
-
136
-
137
-
138
-
139
-
140
-
141
-
142
-
143
-
144
-
145
-
146
-
147
-
148
-
149
-
150
-
151
-
152
-
153
-
154
-
155
-
156
-
157
-
158
-
159
-
160
-
161
-
162
-
163
-
164
-
165
-
166
-
167
-
168
-
169
-
170
-
171
-
172
-
173
-
174
-
175
-
176
-
177
-
178
-
179
-
180
-
181
-
182
-
183
-
184
-
185
-
186
-
187
-
188
-
189
-
190
-
191
-
192
-
193
-
194
-
195
-
196
-
197
-
198
-
199
-
200
-
201
-
202
-
203
-
204
-
205
-
206
-
207
-
208
-
209
-
210
-
211
-
212
-
213
-
214
-
215
-
216
 |
 |

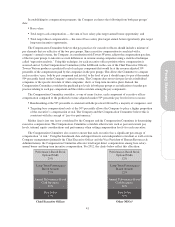
In establishing its compensation programs, the Company evaluates the following from both peer groups’
data:
•Base salary;
•Total target cash compensation — the sum of base salary plus target annual bonus opportunity; and
•Total target direct compensation — the sum of base salary plus target annual bonus opportunity plus target
long-term incentive opportunity.
The Compensation Committee believes that pay practices for executive officers should include a mixture of
pay elements that are reflective of the two peer groups. Since executive compensation is correlated with a
company’s annual revenue, the Company, in consultation with Towers Watson, adjusts the compensation pay data
of the two peer groups to take into account differences in revenue among companies using a statistical technique
called “regression analysis.” Using this technique, for each executive officer position whose compensation is
assessed and set by the Compensation Committee (or the full Board, in the case of the Chief Executive Officer),
Towers Watson produces a predicted level of each pay component that would be at the revenue adjusted 50th
percentile of the compensation paid by the companies in the peer groups. This allows the Committee to compare
each executive’s pay, both by pay component and in total, to the level of pay it should expect to pay at the market
50th percentile based on the Company’s annual revenue. The Company does not review pay levels at individual
companies or the specific structure of other companies’ short- or long-term incentive plans. Instead, the
Compensation Committee considers the predicted pay levels in both peer groups as an indication of market pay
practice relating to each pay component and the relative mixture among the pay components.
The Compensation Committee considers, as one of many factors, each component of executive officer
compensation compared to the predicted revenue adjusted market 50th percentile pay levels for two reasons:
•Benchmarking at the 50th percentile is consistent with the practice followed by a majority of companies, and
•Targeting base compensation levels at the 50th percentile allows the Company to place a higher proportion
of the executive’s compensation at risk. The Company and the Compensation Committee believe this is
consistent with the concept of “pay-for-performance.”
Market data is just one factor considered by the Company and the Compensation Committee in determining
executive compensation. The Compensation Committee considers other factors such as past and current pay
levels, internal equity considerations and performance when setting compensation levels for each executive.
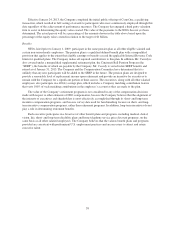
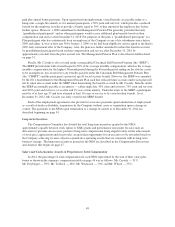
The Compensation Committee also wants to ensure that each executive has a significant percentage of
compensation “at risk.” Using the benchmark data and input from its own independent consultant as well as from
Company management (primarily the Chief Executive Officer and the Vice President of Human Resources &
Administration), the Compensation Committee allocates total target direct compensation among base salary,
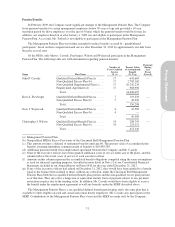
annual bonus and long-term incentive compensation. For 2012, the charts below reflect this allocation:
Performance-Based Stock
Options/SARs
25%
Performance-Based Stock
Options/SARs
12%
Long-Term Performance-
Based Awards
25%
Long-Term Performance-
Based Awards
12%
Annual Performance-Based
Cash Incentive
33%
Annual Performance-Based
Cash Incentive
41%
Base Salary
17%
Base Salary
35%
Chief Executive Officer Other NEOs*
41
Proxy Statement