Cincinnati Bell 2012 Annual Report Download - page 123
Download and view the complete annual report
Please find page 123 of the 2012 Cincinnati Bell annual report below. You can navigate through the pages in the report by either clicking on the pages listed below, or by using the keyword search tool below to find specific information within the annual report.-
 1
1 -
2
-
3
-
4
-
5
-
6
-
7
-
8
-
9
-
10
-
11
-
12
-
13
-
14
-
15
-
16
-
17
-
18
-
19
-
20
-
21
-
22
-
23
-
24
-
25
-
26
-
27
-
28
-
29
-
30
-
31
-
32
-
33
-
34
-
35
-
36
-
37
-
38
-
39
-
40
-
41
-
42
-
43
-
44
-
45
-
46
-
47
-
48
-
49
-
50
-
51
-
52
-
53
-
54
-
55
-
56
-
57
-
58
-
59
-
60
-
61
-
62
-
63
-
64
-
65
-
66
-
67
-
68
-
69
-
70
-
71
-
72
-
73
-
74
-
75
-
76
-
77
-
78
-
79
-
80
-
81
-
82
-
83
-
84
-
85
-
86
-
87
-
88
-
89
-
90
-
91
-
92
-
93
-
94
-
95
-
96
-
97
-
98
-
99
-
100
-
101
-
102
-
103
-
104
-
105
-
106
-
107
-
108
-
109
-
110
-
111
-
112
-
 113
113 -
 114
114 -
 115
115 -
 116
116 -
 117
117 -
 118
118 -
 119
119 -
 120
120 -
 121
121 -
 122
122 -
 123
123 -
 124
124 -
 125
125 -
 126
126 -
 127
127 -
 128
128 -
 129
129 -
 130
130 -
 131
131 -
 132
132 -
 133
133 -
134
-
135
-
136
-
137
-
138
-
139
-
140
-
141
-
142
-
143
-
144
-
145
-
146
-
147
-
148
-
149
-
150
-
151
-
152
-
153
-
154
-
155
-
156
-
157
-
158
-
159
-
160
-
161
-
162
-
163
-
164
-
165
-
166
-
167
-
168
-
169
-
170
-
171
-
172
-
173
-
174
-
175
-
176
-
177
-
178
-
179
-
180
-
181
-
182
-
183
-
184
-
185
-
186
-
187
-
188
-
189
-
190
-
191
-
192
-
193
-
194
-
195
-
196
-
197
-
198
-
199
-
200
-
201
-
202
-
203
-
204
-
205
-
206
-
207
-
208
-
209
-
210
-
211
-
212
-
213
-
214
-
215
-
216
 |
 |

Form 10-K Part II Cincinnati Bell Inc.
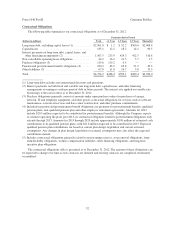
(as defined by the individual indentures). Once this ratio exceeds 4:00 to 1:00, the Company is not in default;
however, additional Indebtedness may only be incurred in specified permitted baskets, including a Credit
Agreement basket providing full access to the Corporate Credit Agreement. Also, the Company’s ability to make
restricted payments would be limited, including common stock dividend payments or repurchasing outstanding
common shares. As of December 31, 2012, the Company was below the 4:00 to 1:00 Consolidated Adjusted
Senior Debt to EBITDA ratio. In addition, the Company had in excess of $200 million available in its restricted
payment basket as of December 31, 2012. If the Company is under the 4:00 to 1:00 ratio on a pro forma basis, the
Company may use this basket to make restricted payments, including share repurchases or dividends, and/or the
Company may designate one or more of its subsidiaries as unrestricted.
Management believes that cash on hand, operating cash flows, its Corporate Credit Agreement and its
Receivables Facility, and the expectation that the Company will continue to have access to capital markets to
refinance debt and other obligations as they mature and come due, should allow the Company to meet its cash
requirements for the foreseeable future.
Cash Flows
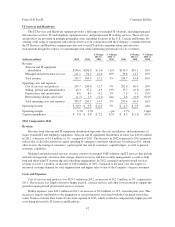
Cash flows from operating activities
Cash provided by operating activities during 2012 was $212.7 million, a decrease of $77.2 million
compared to $289.9 million generated during 2011. This decrease was largely driven by unfavorable changes in
operating assets and liabilities, combined with $6.6 million of higher pension and postretirement payments and
$6.1 million of additional interest payments as noted above.
Cash provided by operating activities during 2011 was $289.9 million, a decrease of $10.1 million
compared to $300.0 million generated during 2010. This decrease included an additional $39.4 million of interest
payments and $18.2 million of higher pension and postretirement payments, partially offset by favorable changes
in operating assets and liabilities. Higher average outstanding debt, resulting from the Cyrus Networks
acquisition in 2010, and higher interest rates on debt refinancings, led to the higher interest payments in 2011.
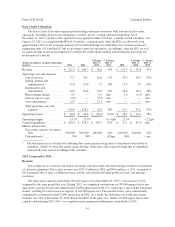
Cash flows from investing activities
Cash flows used in investing activities were $371.8 million in 2012 compared to $244.7 million in 2011 and
$675.5 million in 2010. Capital expenditures were $367.2 million for 2012, which was $111.7 million higher
than 2011 as a result of the continued expansion of data center operations and our Fioptics network. Capital
expenditures were $105.8 million higher for 2011 versus 2010 for the same reasons. In 2012, we deposited $11.1
million of cash into an escrow account and released $4.9 million from this account to fund construction of a data
center. Proceeds from sales of assets were $1.6 million in 2012, primarily from sales of copper cable.
In 2011, the sale of substantially all of the home security monitoring business assets provided cash of $11.5
million, and in June 2010, the Company used cash of approximately $526 million to acquire Cyrus Networks.
Cash flows from financing activities
Cash flows provided by financing activities were $109.0 million in 2012. During 2012, CyrusOne LP and
CyrusOne Finance Corp. issued $525 million of 6
3
⁄
8
% Senior Notes due 2022 and used $480 million of the net
proceeds of $511 million to repay intercompany payables. The Company repaid $442.4 million of debt during the
year, largely with the net proceeds received from CyrusOne, including the redemption of the $247.5 million of
7% Senior Notes due 2015, $91.1 million of 8
3
⁄
8
% Senior Notes due 2020, purchased pursuant to a tender offer
completed in the fourth quarter of 2012, and $73.0 million of various series of CBT Notes due 2023. The
Company also used the net proceeds received from CyrusOne to pay the redemption premiums, debt issuance and
other costs associated with this series of transactions and to repay the outstanding borrowings on our prior credit
facility of $40 million. In 2012, the Company also borrowed $52.0 million under its Receivables Facility and
received cash proceeds of $12.1 million from the exercise of stock options and warrants. In 2012, cash was used
to pay $10.4 million of preferred stock dividends and to fund $5.7 million of costs associated with the CyrusOne
IPO.
49
Form 10-K