Cincinnati Bell 2012 Annual Report Download - page 183
Download and view the complete annual report
Please find page 183 of the 2012 Cincinnati Bell annual report below. You can navigate through the pages in the report by either clicking on the pages listed below, or by using the keyword search tool below to find specific information within the annual report.-
 1
1 -
2
-
3
-
4
-
5
-
6
-
7
-
8
-
9
-
10
-
11
-
12
-
13
-
14
-
15
-
16
-
17
-
18
-
19
-
20
-
21
-
22
-
23
-
24
-
25
-
26
-
27
-
28
-
29
-
30
-
31
-
32
-
33
-
34
-
35
-
36
-
37
-
38
-
39
-
40
-
41
-
42
-
43
-
44
-
45
-
46
-
47
-
48
-
49
-
50
-
51
-
52
-
53
-
54
-
55
-
56
-
57
-
58
-
59
-
60
-
61
-
62
-
63
-
64
-
65
-
66
-
67
-
68
-
69
-
70
-
71
-
72
-
73
-
74
-
75
-
76
-
77
-
78
-
79
-
80
-
81
-
82
-
83
-
84
-
85
-
86
-
87
-
88
-
89
-
90
-
91
-
92
-
93
-
94
-
95
-
96
-
97
-
98
-
99
-
100
-
101
-
102
-
103
-
104
-
105
-
106
-
107
-
108
-
109
-
110
-
111
-
112
-
113
-
114
-
115
-
116
-
117
-
118
-
119
-
120
-
121
-
122
-
123
-
124
-
125
-
126
-
127
-
128
-
129
-
130
-
131
-
132
-
133
-
134
-
135
-
136
-
137
-
138
-
139
-
140
-
141
-
142
-
143
-
144
-
145
-
146
-
147
-
148
-
149
-
150
-
151
-
152
-
153
-
154
-
155
-
156
-
157
-
158
-
159
-
160
-
161
-
162
-
163
-
164
-
165
-
166
-
167
-
168
-
169
-
170
-
171
-
172
-
 173
173 -
 174
174 -
 175
175 -
 176
176 -
 177
177 -
 178
178 -
 179
179 -
 180
180 -
 181
181 -
 182
182 -
 183
183 -
 184
184 -
 185
185 -
 186
186 -
 187
187 -
 188
188 -
 189
189 -
 190
190 -
 191
191 -
 192
192 -
 193
193 -
194
-
195
-
196
-
197
-
198
-
199
-
200
-
201
-
202
-
203
-
204
-
205
-
206
-
207
-
208
-
209
-
210
-
211
-
212
-
213
-
214
-
215
-
216
 |
 |

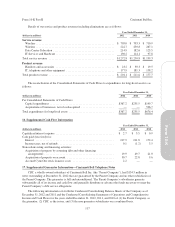
Form 10-K Part II Cincinnati Bell Inc.
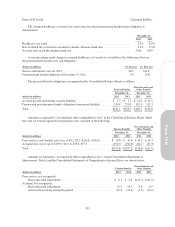
The following is a reconciliation of the statutory federal income tax rate with the effective tax rate for each
year:
Year Ended December 31,
2012 2011 2010
U.S. federal statutory rate ................................................... 35.0% 35.0% 35.0%
State and local income taxes, net of federal income tax ............................ 3.9 2.9 2.6
Change in valuation allowance, net of federal income tax .......................... (2.3) (4.4) (7.1)
State net operating loss adjustments ........................................... 3.7 2.7 0.1
Nondeductible interest expense ............................................... 18.1 15.0 13.3
Medicare drug subsidy law change ............................................ — — 5.8
Unrecognized tax benefit changes ............................................ 2.2 2.8 5.7
Nondeductible compensation ................................................ 2.7 2.1 1.5
Foreign ................................................................. 3.5 0.1 0.8
Other differences, net ...................................................... 2.0 1.1 0.2
Effective tax rate .......................................................... 68.8% 57.3% 57.9%
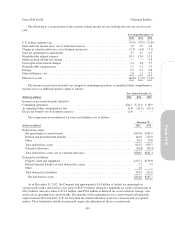
The income tax provision (benefit) was charged to continuing operations, accumulated other comprehensive
income/ (loss) or additional paid-in capital as follows:
Year Ended December 31,
(dollars in millions) 2012 2011 2010
Income tax provision (benefit) related to:
Continuing operations .................................................... $24.7 $ 25.0 $ 38.9
Accumulated other comprehensive loss ...................................... (0.4) (26.5) (13.2)
Excess tax benefits on stock option exercises .................................. (2.4) — —
The components of our deferred tax assets and liabilities are as follows:
December 31,
(dollars in millions) 2012 2011
Deferred tax assets:
Net operating loss carryforwards ............................................... $410.8 $453.9
Pension and postretirement benefits ............................................. 144.6 155.0
Other ..................................................................... 69.9 70.8
Total deferred tax assets ...................................................... 625.3 679.7
Valuation allowance ......................................................... (56.8) (58.4)
Total deferred tax assets, net of valuation allowance ................................ $568.5 $621.3
Deferred tax liabilities:
Property, plant and equipment ................................................. $125.1 $159.8
Federal deferred liability on state deferred tax assets ................................ 7.2 7.8
Other ..................................................................... 1.6 —
Total deferred tax liabilities ................................................... 133.9 167.6
Net deferred tax assets ...................................................... $434.6 $453.7
As of December 31, 2012, the Company had approximately $1.0 billion of federal tax operating loss
carryforwards with a deferred tax asset value of $352.0 million, alternative minimum tax credit carryforwards of
$16.5 million, state tax credits of $11.4 million, and $58.8 million in deferred tax assets related to foreign, state
and local tax operating loss carryforwards. The majority of the remaining tax loss carryforwards will generally
expire between 2021 and 2023. U.S. tax laws limit the annual utilization of tax loss carryforwards of acquired
entities. These limitations should not materially impact the utilization of the tax carryforwards.
109
Form 10-K