Cigna 2014 Annual Report Download - page 97
Download and view the complete annual report
Please find page 97 of the 2014 Cigna annual report below. You can navigate through the pages in the report by either clicking on the pages listed below, or by using the keyword search tool below to find specific information within the annual report.-
 1
1 -
2
-
3
-
4
-
5
-
6
-
7
-
8
-
9
-
10
-
11
-
12
-
13
-
14
-
15
-
16
-
17
-
18
-
19
-
20
-
21
-
22
-
23
-
24
-
25
-
26
-
27
-
28
-
29
-
30
-
31
-
32
-
33
-
34
-
35
-
36
-
37
-
38
-
39
-
40
-
41
-
42
-
43
-
44
-
45
-
46
-
47
-
48
-
49
-
50
-
51
-
52
-
53
-
54
-
55
-
56
-
57
-
58
-
59
-
60
-
61
-
62
-
63
-
64
-
65
-
66
-
67
-
68
-
69
-
70
-
71
-
72
-
73
-
74
-
75
-
76
-
77
-
78
-
79
-
80
-
81
-
82
-
83
-
84
-
85
-
86
-
 87
87 -
 88
88 -
 89
89 -
 90
90 -
 91
91 -
 92
92 -
 93
93 -
 94
94 -
 95
95 -
 96
96 -
 97
97 -
 98
98 -
 99
99 -
 100
100 -
 101
101 -
 102
102 -
 103
103 -
 104
104 -
 105
105 -
 106
106 -
 107
107 -
108
-
109
-
110
-
111
-
112
-
113
-
114
-
115
-
116
-
117
-
118
-
119
-
120
-
121
-
122
-
123
-
124
-
125
-
126
-
127
-
128
-
129
-
130
-
131
-
132
-
133
-
134
-
135
-
136
-
137
-
138
-
139
-
140
-
141
-
142
-
143
-
144
-
145
-
146
-
147
-
148
-
149
-
150
-
151
-
152
-
153
-
154
-
155
-
156
-
157
-
158
-
159
-
160
-
161
-
162
-
163
-
164
-
165
-
166
-
167
-
168
-
169
-
170
-
171
-
172
-
173
-
174
-
175
-
176
-
177
-
178
-
179
-
180
-
181
-
182
 |
 |

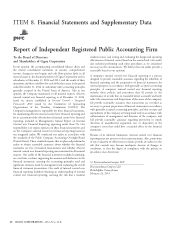
PART II
ITEM 8. Financial Statements and Supplementary Data
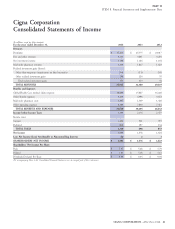
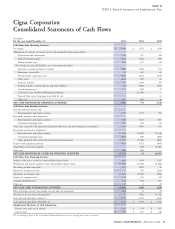
Cigna Corporation
Consolidated Statements of Cash Flows
(In millions)
For the years ended December 31, 2014 2013 2012
Cash Flows from Operating Activities
Net income $ 2,094 $ 1,478 $ 1,624
Adjustments to reconcile net income to net cash provided by operating activities:
Depreciation and amortization 588 597 560
Realized investment gains (154) (213) (44)
Deferred income taxes (22) 197 134
Net changes in assets and liabilities, net of non-operating effects:
Premiums, accounts and notes receivable (780) (110) (71)
Reinsurance recoverables 22 369 62
Deferred policy acquisition costs (176) (227) (159)
Other assets (265) 405 31
Insurance liabilities 457 1,040 245
Accounts payable, accrued expenses and other liabilities 202 (483) (132)
Current income taxes 111 (56) 29
Cash used to exit the Run-off Reinsurance Business – (2,196) –
Proceeds from sales of mortgage loans held for sale – – 61
Other, net (83) (82) 10
NET CASH PROVIDED BY OPERATING ACTIVITIES 1,994 719 2,350
Cash Flows from Investing Activities
Proceeds from investments sold:
Fixed maturities and equity securities 1,769 1,775 591
Investment maturities and repayments:
Fixed maturities and equity securities 1,640 1,621 1,507
Commercial mortgage loans 453 653 722
Other sales, maturities and repayments (primarily short-term and other long-term investments) 2,706 1,661 831
Investments purchased or originated:
Fixed maturities and equity securities (5,424) (3,062) (2,334)
Commercial mortgage loans (287) (58) (364)
Other (primarily short-term and other long-term investments) (2,115) (1,930) (821)
Property and equipment purchases (473) (527) (408)
Acquisitions, net of cash acquired – (76) (3,581)
Other, net (24) (42) –
NET CASH PROVIDED BY / (USED IN) INVESTING ACTIVITIES (1,755) 15 (3,857)
Cash Flows from Financing Activities
Deposits and interest credited to contractholder deposit funds 1,482 1,399 1,337
Withdrawals and benefit payments from contractholder deposit funds (1,456) (1,358) (1,264)
Net change in short-term debt (112) (101) 98
Repayment of long-term debt – (15) (326)
Repurchase of common stock (1,612) (1,003) (208)
Issuance of common stock 110 150 121
Common dividends paid (11) (11) (11)
Other, net 17 9 25
NET CASH USED IN FINANCING ACTIVITIES (1,582) (930) (228)
Effect of foreign currency rate changes on cash and cash equivalents (32) 13 23
Net decrease in cash and cash equivalents (1,375) (183) (1,712)
Cash and cash equivalents, January 1, 2,795 2,978 4,690
Cash and cash equivalents, December 31, $ 1,420 $ 2,795 $ 2,978
Supplemental Disclosure of Cash Information:
Income taxes paid, net of refunds $ 1,085 $ 519 $ 655
Interest paid $ 259 $ 265 $ 248
The accompanying Notes to the Consolidated Financial Statements are an integral part of these statements.
CIGNA CORPORATION - 2014 Form 10-K 65