Cigna 2014 Annual Report Download - page 83
Download and view the complete annual report
Please find page 83 of the 2014 Cigna annual report below. You can navigate through the pages in the report by either clicking on the pages listed below, or by using the keyword search tool below to find specific information within the annual report.-
 1
1 -
2
-
3
-
4
-
5
-
6
-
7
-
8
-
9
-
10
-
11
-
12
-
13
-
14
-
15
-
16
-
17
-
18
-
19
-
20
-
21
-
22
-
23
-
24
-
25
-
26
-
27
-
28
-
29
-
30
-
31
-
32
-
33
-
34
-
35
-
36
-
37
-
38
-
39
-
40
-
41
-
42
-
43
-
44
-
45
-
46
-
47
-
48
-
49
-
50
-
51
-
52
-
53
-
54
-
55
-
56
-
57
-
58
-
59
-
60
-
61
-
62
-
63
-
64
-
65
-
66
-
67
-
68
-
69
-
70
-
71
-
72
-
 73
73 -
 74
74 -
 75
75 -
 76
76 -
 77
77 -
 78
78 -
 79
79 -
 80
80 -
 81
81 -
 82
82 -
 83
83 -
 84
84 -
 85
85 -
 86
86 -
 87
87 -
 88
88 -
 89
89 -
 90
90 -
 91
91 -
 92
92 -
 93
93 -
94
-
95
-
96
-
97
-
98
-
99
-
100
-
101
-
102
-
103
-
104
-
105
-
106
-
107
-
108
-
109
-
110
-
111
-
112
-
113
-
114
-
115
-
116
-
117
-
118
-
119
-
120
-
121
-
122
-
123
-
124
-
125
-
126
-
127
-
128
-
129
-
130
-
131
-
132
-
133
-
134
-
135
-
136
-
137
-
138
-
139
-
140
-
141
-
142
-
143
-
144
-
145
-
146
-
147
-
148
-
149
-
150
-
151
-
152
-
153
-
154
-
155
-
156
-
157
-
158
-
159
-
160
-
161
-
162
-
163
-
164
-
165
-
166
-
167
-
168
-
169
-
170
-
171
-
172
-
173
-
174
-
175
-
176
-
177
-
178
-
179
-
180
-
181
-
182
 |
 |
PART II
ITEM 7. Management’s Discussion and Analysis of Financial Condition and Results of Operations
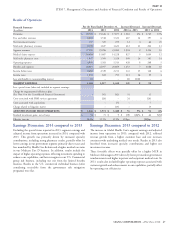
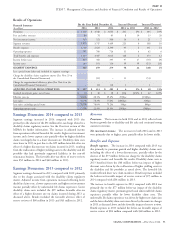
Results of Operations
For the Years Ended December 31, Increase/(Decrease) Increase/(Decrease)
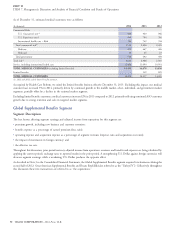
Financial Summary
(In millions)
2014 2013 2012 2014 vs. 2013 2013 vs. 2012
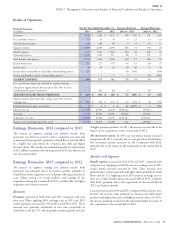
Premiums $ 2,844 $ 2,496 $ 1,975 $ 348 14% $ 521 26%
Fees and other revenues 52 43 30 9 21 13 43
Net investment income 109 100 90 9 9 10 11
Segment revenues 3,005 2,639 2,095 366 14 544 26
Benefit expenses 1,544 1,310 1,005 234 18 305 30
Operating expenses 1,190 1,102 911 88 8 191 21
Total benefits and expenses 2,734 2,412 1,916 322 13 496 26
Income before taxes 271 227 179 44 19 48 27
Income taxes 48 50 36 (2) (4) 14 39
Income (loss) attributable to redeemable noncontrolling interest (7) 2 – (9) N/M 2 N/M
Income attributable to other noncontrolling interest – – 1 – – (1) (100)
SEGMENT EARNINGS 230 175 142 55 31 33 23
Less: special items (after-tax) included in segment earnings:
Charges for organizational efficiency plans (See Note 6 to the
Consolidated Financial Statements) – (8) (6) 8 (2)
ADJUSTED INCOME FROM OPERATIONS $ 230 $ 183 $ 148 $ 47 26% $ 35 24%
Adjusted income from operations, using actual 2014 currency
exchange rates $ 230 $ 190 $ 152 $ 40 21% $ 38 25%
Realized investment gains, net of taxes $ 3 $ 5 $ 1 $ (2) (40)% $ 4 N/M
Effective tax rate 17.7% 22.0% 20.1% (430) bps 190 bps
Loss ratio 54.3% 52.5% 50.9% 180 bps 160 bps
Acquisition cost ratio 21.4% 23.6% 25.1% (220) bps (150) bps
Expense ratio (excluding acquisition costs) 18.2% 18.2% 18.4% – bps (20) bps
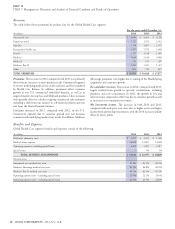
of higher premium products. In 2013, the increase was also due to the
Earnings Discussion: 2014 compared to 2013
impact of the acquisitions in the second half of 2012.
The increase in segment earnings and adjusted income from Net investment income. In 2014, net investment income increased
operations was driven in part by a lower acquisition cost ratio and compared with 2013, primarily due to asset growth in South Korea.
continuing business growth, primarily in South Korea, partially offset Net investment income increased in 2013 compared with 2012,
by a higher loss ratio driven by a business mix shift and higher primarily due to the impact of the acquisitions in the second half of
incurred claims. 2014 results also included favorable tax-related items 2012.
of $21 million recorded in the third quarter of 2014 (see effective tax
rate discussion below).
Benefits and Expenses
Benefit expenses increased in both 2014 and 2013, compared with
Earnings Discussion: 2013 compared to 2012
each prior year. Applying actual 2014 currency exchange rates to 2013
The increase in segment earnings and adjusted income from results, benefit expenses increased by 16%. These increases were
operations was primarily driven by business growth, primarily in primarily due to business growth and higher claims primarily in South
South Korea, lower acquisition costs in Europe reflecting a decision to Korea and the U.S. Applying actual 2014 currency exchange rates to
cease selling activities in certain markets, and earnings of the prior year results, benefit expenses increased 28% in 2013, compared
acquisitions during the second half of 2013, partially offset by higher with 2012, primarily due to the acquisitions in the second half of
acquisition and benefits expenses. 2012 and business growth.
Loss ratios increased in 2014 and 2013 compared with each prior year.
Revenues
In 2014, the increase is due primarily to a business mix shift toward
Premiums increased in both 2014 and 2013 compared with each products with higher loss ratios and higher incurred claims. For 2013,
prior year. When applying 2014 exchange rates to 2013 and 2012 the increase primarily results from the inherently higher loss ratios of
results, premiums increased by 13% in 2014 and 25% in 2013. These the acquisitions in the second half of 2012.
increases were primarily attributable to new sales, particularly in
South Korea and the U.S. reflecting both customer growth and sales
CIGNA CORPORATION - 2014 Form 10-K 51