Cigna 2014 Annual Report Download - page 88
Download and view the complete annual report
Please find page 88 of the 2014 Cigna annual report below. You can navigate through the pages in the report by either clicking on the pages listed below, or by using the keyword search tool below to find specific information within the annual report.-
 1
1 -
2
-
3
-
4
-
5
-
6
-
7
-
8
-
9
-
10
-
11
-
12
-
13
-
14
-
15
-
16
-
17
-
18
-
19
-
20
-
21
-
22
-
23
-
24
-
25
-
26
-
27
-
28
-
29
-
30
-
31
-
32
-
33
-
34
-
35
-
36
-
37
-
38
-
39
-
40
-
41
-
42
-
43
-
44
-
45
-
46
-
47
-
48
-
49
-
50
-
51
-
52
-
53
-
54
-
55
-
56
-
57
-
58
-
59
-
60
-
61
-
62
-
63
-
64
-
65
-
66
-
67
-
68
-
69
-
70
-
71
-
72
-
73
-
74
-
75
-
76
-
77
-
 78
78 -
 79
79 -
 80
80 -
 81
81 -
 82
82 -
 83
83 -
 84
84 -
 85
85 -
 86
86 -
 87
87 -
 88
88 -
 89
89 -
 90
90 -
 91
91 -
 92
92 -
 93
93 -
 94
94 -
 95
95 -
 96
96 -
 97
97 -
 98
98 -
99
-
100
-
101
-
102
-
103
-
104
-
105
-
106
-
107
-
108
-
109
-
110
-
111
-
112
-
113
-
114
-
115
-
116
-
117
-
118
-
119
-
120
-
121
-
122
-
123
-
124
-
125
-
126
-
127
-
128
-
129
-
130
-
131
-
132
-
133
-
134
-
135
-
136
-
137
-
138
-
139
-
140
-
141
-
142
-
143
-
144
-
145
-
146
-
147
-
148
-
149
-
150
-
151
-
152
-
153
-
154
-
155
-
156
-
157
-
158
-
159
-
160
-
161
-
162
-
163
-
164
-
165
-
166
-
167
-
168
-
169
-
170
-
171
-
172
-
173
-
174
-
175
-
176
-
177
-
178
-
179
-
180
-
181
-
182
 |
 |

PART II
ITEM 7. Management’s Discussion and Analysis of Financial Condition and Results of Operations
Fixed Maturities
Investments in fixed maturities include publicly traded and privately placed debt securities, mortgage and other asset-backed securities, and
preferred stocks redeemable by the investor. These investments are classified as available for sale and are carried at fair value on our balance sheet.
Additional information regarding valuation methodologies, key inputs and controls is included in Note 10 of the Consolidated Financial
Statements.
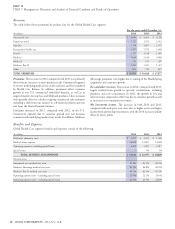
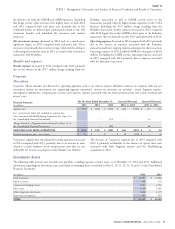
The following table reflects our fixed maturity portfolio by type of issuer as of December 31, 2014 and 2013.
(In millions)
2014 2013
Federal government and agency $ 954 $ 880
State and local government 1,856 2,144
Foreign government 1,940 1,444
Corporate 13,498 10,981
Mortgage-backed 85 153
Other asset-backed 650 884
TOTAL $ 18,983 $ 16,486
The fixed maturity portfolio increased approximately $2.5 billion investments are primarily concentrated in Asia consistent with the
during 2014, reflecting increased investment in fixed maturities and geographic distribution of our international business operations.
the impact of decreased market yields on asset valuations. Although Foreign government obligations also include $218 million of
overall asset values are well in excess of amortized cost, there are investments in European sovereign debt, none of which are in
specific securities with amortized cost in excess of fair value by countries with significant political or economic concerns (Portugal,
$42 million in aggregate as of December 31, 2014. See Note 11 to the Italy, Ireland, Greece, and Spain).
Consolidated Financial Statements for further information. Corporate fixed maturities include private placement investments of
As of December 31, 2014, $17.1 billion, or 90%, of the fixed $5.2 billion that are generally less marketable than publicly-traded
maturities in our investment portfolio were investment grade (Baa and bonds. However, yields on these investments tend to be higher than
above, or equivalent), and the remaining $1.9 billion were below yields on publicly-traded bonds with comparable credit risk. We
investment grade. The majority of the bonds that are below perform a credit analysis of each issuer, diversify investments by
investment grade are rated at the higher end of the non-investment industry and issuer and require financial and other covenants that
grade spectrum. These quality characteristics have not materially allow us to monitor issuers for deteriorating financial strength and
changed during the year. pursue remedial actions, if warranted. Corporate fixed maturities
include $343 million of investments in companies that are domiciled
Our investment in state and local government securities, with an or have significant business interests in Italy, Ireland, and Spain. These
average quality rating of Aa2 is diversified by issuer and geography investments have an average quality rating of Baa2 and are diversified
with no single exposure greater than $28 million. We assess each by industry sector, including approximately 2% invested in financial
issuer’s credit quality based on a fundamental analysis of underlying institutions. Corporate fixed maturities also include investments in
financial information and do not rely solely on statistical rating the energy and natural gas sector of $1.4 billion that have an average
organizations or monoline insurer guarantees. quality rating of Baa and are diversified by issuer with no single
We invest in high quality foreign government obligations, with an exposure greater than $45 million.
average quality rating of Aa3 as of December 31, 2014. These
Commercial Mortgage Loans
Our commercial mortgage loans are fixed rate loans, diversified by 64% as of December 31, 2013, reflecting a modest increase in values
property type, location and borrower. Loans are secured by high for high quality commercial real estate. The portfolio’s average debt
quality commercial properties and are generally made at less than 75% service coverage ratio also improved, increasing to 1.66 at
of the property’s value at origination of the loan. Property value, debt December 31, 2014 from 1.62 as of December 31, 2013. See Note 11
service coverage, quality, building tenancy and stability of cash flows to the Consolidated Financial Statements for further information.
are all important financial underwriting considerations. We hold no Commercial real estate capital markets remain most active for well
direct residential mortgage loans and do not securitize or service leased, quality commercial real estate located in strong institutional
mortgage loans. investment markets. The vast majority of properties securing the
We completed an annual in-depth review of our commercial mortgage mortgages in our mortgage portfolio possess these characteristics.
loan portfolio during the second quarter of 2014. This review While commercial real estate fundamentals continued to improve, the
included an analysis of each property’s year-end 2013 financial improvement has varied across geographies and property types.
statements, rent rolls, operating plans and budgets for 2014, a physical The commercial mortgage loan portfolio contains approximately 80
inspection of the property and other pertinent factors. Based on loans, including five impaired loans with a carrying value totaling
property values and cash flows estimated as part of this review and $166 million that are classified as problem or potential problem loans.
subsequent fundings and repayments, the portfolio’s average Two of these loans totaling $86 million, net of $4 million in reserves,
loan-to-value ratio improved to 63% at December 31, 2014, from are current based on restructured terms and three loans totaling
56 CIGNA CORPORATION - 2014 Form 10-K