Cigna 2014 Annual Report Download - page 123
Download and view the complete annual report
Please find page 123 of the 2014 Cigna annual report below. You can navigate through the pages in the report by either clicking on the pages listed below, or by using the keyword search tool below to find specific information within the annual report.-
 1
1 -
2
-
3
-
4
-
5
-
6
-
7
-
8
-
9
-
10
-
11
-
12
-
13
-
14
-
15
-
16
-
17
-
18
-
19
-
20
-
21
-
22
-
23
-
24
-
25
-
26
-
27
-
28
-
29
-
30
-
31
-
32
-
33
-
34
-
35
-
36
-
37
-
38
-
39
-
40
-
41
-
42
-
43
-
44
-
45
-
46
-
47
-
48
-
49
-
50
-
51
-
52
-
53
-
54
-
55
-
56
-
57
-
58
-
59
-
60
-
61
-
62
-
63
-
64
-
65
-
66
-
67
-
68
-
69
-
70
-
71
-
72
-
73
-
74
-
75
-
76
-
77
-
78
-
79
-
80
-
81
-
82
-
83
-
84
-
85
-
86
-
87
-
88
-
89
-
90
-
91
-
92
-
93
-
94
-
95
-
96
-
97
-
98
-
99
-
100
-
101
-
102
-
103
-
104
-
105
-
106
-
107
-
108
-
109
-
110
-
111
-
112
-
 113
113 -
 114
114 -
 115
115 -
 116
116 -
 117
117 -
 118
118 -
 119
119 -
 120
120 -
 121
121 -
 122
122 -
 123
123 -
 124
124 -
 125
125 -
 126
126 -
 127
127 -
 128
128 -
 129
129 -
 130
130 -
 131
131 -
 132
132 -
 133
133 -
134
-
135
-
136
-
137
-
138
-
139
-
140
-
141
-
142
-
143
-
144
-
145
-
146
-
147
-
148
-
149
-
150
-
151
-
152
-
153
-
154
-
155
-
156
-
157
-
158
-
159
-
160
-
161
-
162
-
163
-
164
-
165
-
166
-
167
-
168
-
169
-
170
-
171
-
172
-
173
-
174
-
175
-
176
-
177
-
178
-
179
-
180
-
181
-
182
 |
 |
PART II
ITEM 8. Financial Statements and Supplementary Data
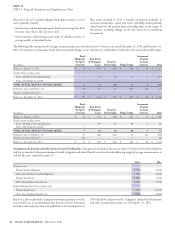
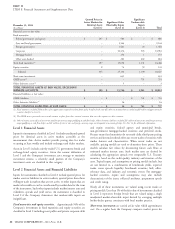
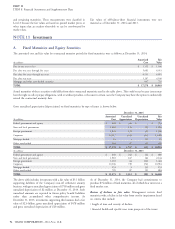
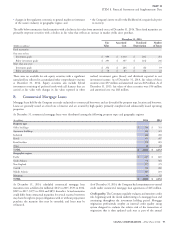
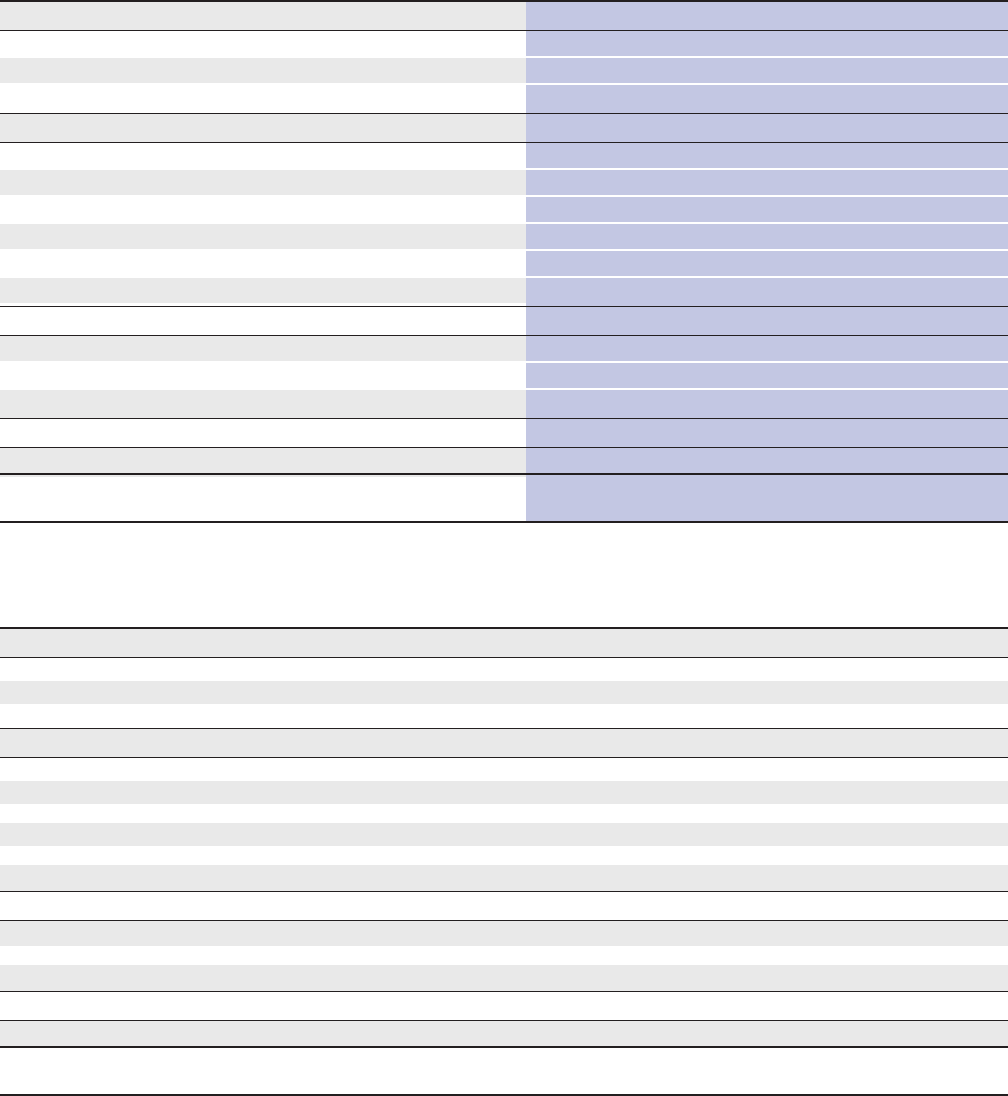
assets accrue directly to the policyholders. Gains and losses reported in these tables may include net changes in fair value that are attributable to
both observable and unobservable inputs.
Fixed
Maturities &
(In millions)
Equity Securities GMIB Assets GMIB Liabilities GMIB Net
Balance at January 1, 2014 $ 1,190 $ 751 $ (741) $ 10
Gains (losses) included in shareholders’ net income:
GMIB fair value gain/(loss) – 251 (251) –
Other 15 (1) 15 14
Total gains (losses) included in shareholders’ net income 15 250 (236) 14
Gains included in other comprehensive income 14 – – –
Gains required to adjust future policy benefits for settlement annuities
(1)
55 – – –
Purchases, sales, settlements:
Purchases 101 – – –
Sales (202) – – –
Settlements (156) (48) 48 –
Total purchases, sales and settlements (257) (48) 48 –
Transfers into/(out of ) Level 3:
Transfers into Level 3 165 – – –
Transfers out of Level 3 (325) – – –
Total transfers into/(out of) Level 3 (160) – – –
Balance at December 31, 2014 $ 857 $ 953 $ (929) $ 24
Total gains (losses) included in shareholders’ net income attributable to
instruments held at the reporting date $ 2 $ 250 $ (236) $ 14
(1) Amounts do not accrue to shareholders.
Fixed
Maturities &
(In millions)
Equity Securities GMIB Assets GMIB Liabilities GMIB Net
Balance at January 1, 2013 $ 1,351 $ 622 $ (1,170) $ (548)
Gains (losses) included in shareholders’ net income:
GMIB fair value gain/(loss) – (380) 380 –
Other 16 17 (23) (6)
Total gains (losses) included in shareholders’ net income 16 (363) 357 (6)
Losses included in other comprehensive income (19) – – –
Losses required to adjust future policy benefits for settlement annuities
(1)
(50) – – –
Purchases, sales, settlements:
Purchases 110 – – –
Sales (64) – – –
Settlements (121) 492 72 564
Total purchases, sales, and settlements (75) 492 72 564
Transfers into/(out of ) Level 3:
Transfers into Level 3 115 – – –
Transfers out of Level 3 (148) – – –
Total transfers into/(out of) Level 3 (33) – – –
Balance at December 31, 2013 $ 1,190 $ 751 $ (741) $ 10
Total gains (losses) included in shareholders’ net income attributable to
instruments held at the reporting date $ 7 $ (363) $ 357 $ (6)
(1) Amounts do not accrue to shareholders.
CIGNA CORPORATION - 2014 Form 10-K 91