Cigna 2014 Annual Report Download - page 107
Download and view the complete annual report
Please find page 107 of the 2014 Cigna annual report below. You can navigate through the pages in the report by either clicking on the pages listed below, or by using the keyword search tool below to find specific information within the annual report.-
 1
1 -
2
-
3
-
4
-
5
-
6
-
7
-
8
-
9
-
10
-
11
-
12
-
13
-
14
-
15
-
16
-
17
-
18
-
19
-
20
-
21
-
22
-
23
-
24
-
25
-
26
-
27
-
28
-
29
-
30
-
31
-
32
-
33
-
34
-
35
-
36
-
37
-
38
-
39
-
40
-
41
-
42
-
43
-
44
-
45
-
46
-
47
-
48
-
49
-
50
-
51
-
52
-
53
-
54
-
55
-
56
-
57
-
58
-
59
-
60
-
61
-
62
-
63
-
64
-
65
-
66
-
67
-
68
-
69
-
70
-
71
-
72
-
73
-
74
-
75
-
76
-
77
-
78
-
79
-
80
-
81
-
82
-
83
-
84
-
85
-
86
-
87
-
88
-
89
-
90
-
91
-
92
-
93
-
94
-
95
-
96
-
 97
97 -
 98
98 -
 99
99 -
 100
100 -
 101
101 -
 102
102 -
 103
103 -
 104
104 -
 105
105 -
 106
106 -
 107
107 -
 108
108 -
 109
109 -
 110
110 -
 111
111 -
 112
112 -
 113
113 -
 114
114 -
 115
115 -
 116
116 -
 117
117 -
118
-
119
-
120
-
121
-
122
-
123
-
124
-
125
-
126
-
127
-
128
-
129
-
130
-
131
-
132
-
133
-
134
-
135
-
136
-
137
-
138
-
139
-
140
-
141
-
142
-
143
-
144
-
145
-
146
-
147
-
148
-
149
-
150
-
151
-
152
-
153
-
154
-
155
-
156
-
157
-
158
-
159
-
160
-
161
-
162
-
163
-
164
-
165
-
166
-
167
-
168
-
169
-
170
-
171
-
172
-
173
-
174
-
175
-
176
-
177
-
178
-
179
-
180
-
181
-
182
 |
 |
PART II
ITEM 8. Financial Statements and Supplementary Data
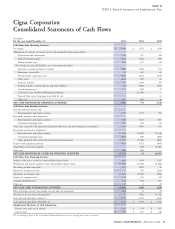
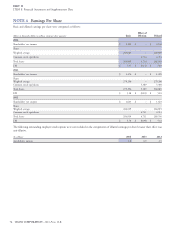
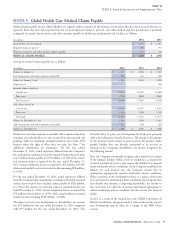
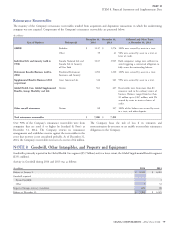
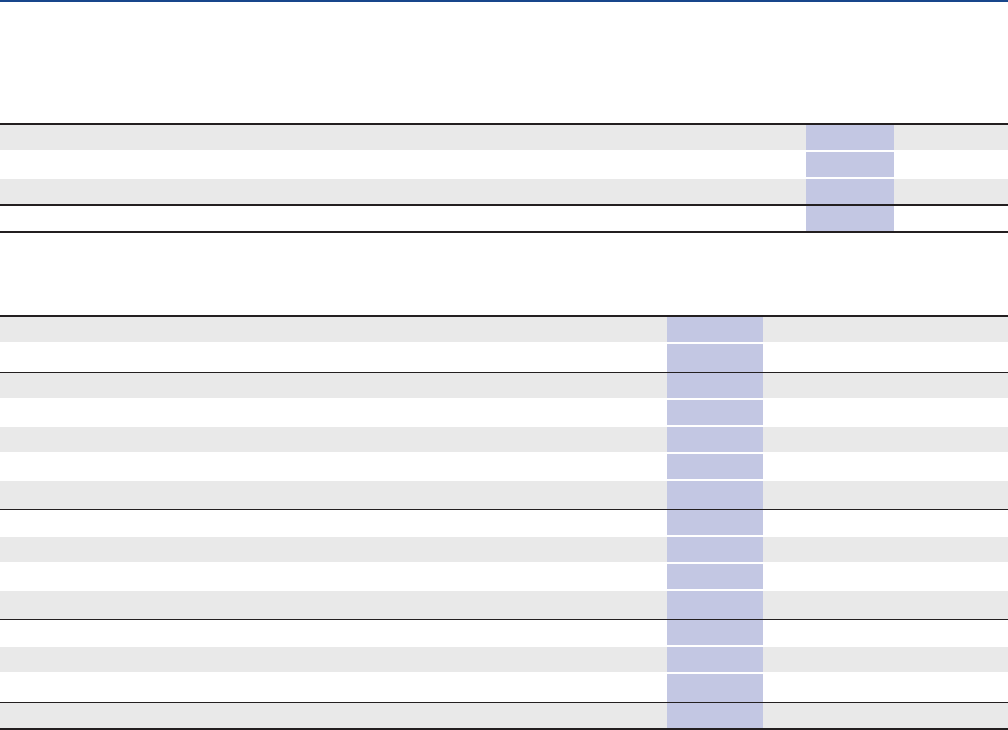
Global Health Care Medical Claims Payable
Medical claims payable for the Global Health Care segment reflects estimates of the ultimate cost of claims that have been incurred but not yet
reported, those that have been reported but not yet paid (reported claims in process), and other medical expenses payable that is primarily
comprised of accruals for incentives and other amounts payable to health care professionals and facilities, as follows:
(In millions)
2014 2013
Incurred but not yet reported $ 1,777 $ 1,615
Reported claims in process 288 355
Physician incentives and other medical expense payable 115 80
MEDICAL CLAIMS PAYABLE $ 2,180 $ 2,050
Activity in medical claims payable was as follows:
(In millions)
2014 2013 2012
Balance at January 1, $ 2,050 $ 1,856 $ 1,305
Less: Reinsurance and other amounts recoverable 194 242 249
Balance at January 1, net 1,856 1,614 1,056
Acquired net: – – 504
Incurred claims related to:
Current year 16,853 16,049 14,428
Prior years (159) (182) (200)
Total incurred 16,694 15,867 14,228
Paid claims related to:
Current year 14,966 14,267 12,854
Prior years 1,656 1,358 1,320
Total paid 16,622 15,625 14,174
Balance at December 31, net 1,928 1,856 1,614
Add: Reinsurance and other amounts recoverable 252 194 242
Balance at December 31, $ 2,180 $ 2,050 $ 1,856
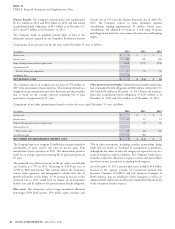
Reinsurance and other amounts recoverable reflect amounts due from favorable effect of prior year development for both years primarily
reinsurers and policyholders to cover incurred but not reported and reflects low utilization of medical services. The change in the amount
pending claims for minimum premium products and certain ASO of the incurred claims related to prior years in the medical claims
business where the right of offset does not exist. See Note 7 for payable liability does not directly correspond to an increase or
additional information on reinsurance. For the year ended decrease in the Company’s shareholders’ net income recognized for
December 31, 2014, actual experience differed from the Company’s the following reasons:
key assumptions resulting in favorable incurred claims related to prior First, the Company consistently recognizes the actuarial best estimate
years’ medical claims payable of $159 million, or 1.0% of the current of the ultimate liability within a level of confidence, as required by
year incurred claims as reported for the year ended December 31, actuarial standards of practice that require the liabilities be adequate
2013. Actual completion factors accounted for $61 million, or 0.4%, under moderately adverse conditions. As the Company establishes the
while actual medical cost trend resulted in the remaining $98 million, liability for each incurral year, the Company ensures that its
or 0.6%. assumptions appropriately consider moderately adverse conditions.
For the year ended December 31, 2013, actual experience differed When a portion of the development relates to a release of the prior
from the Company’s key assumptions, resulting in favorable incurred year’s provision for moderately adverse conditions, the Company does
claims related to prior years’ medical claims payable of $182 million, not consider that amount as impacting shareholders’ net income to
or 1.3% of the current year incurred claims as reported for the year the extent that it is offset by an increase determined appropriate to
ended December 31, 2012. Actual completion factors accounted for address moderately adverse conditions for the current year incurred
$74 million of favorability, or 0.5%, while actual medical cost trend claims.
resulted in the remaining $108 million, or 0.8%. Second, as a result of the medical loss ratio (‘‘MLR’’) provisions of
The impact of prior year development on shareholders’ net income Health Care Reform, changes in medical claim estimates due to prior
was $53 million for the year ended December 31, 2014 compared year development may be offset by a change in the MLR rebate
with $77 million for the year ended December 31, 2013. The accrual.
CIGNA CORPORATION - 2014 Form 10-K 75
NOTE 5