Cigna 2014 Annual Report Download - page 143
Download and view the complete annual report
Please find page 143 of the 2014 Cigna annual report below. You can navigate through the pages in the report by either clicking on the pages listed below, or by using the keyword search tool below to find specific information within the annual report.-
 1
1 -
2
-
3
-
4
-
5
-
6
-
7
-
8
-
9
-
10
-
11
-
12
-
13
-
14
-
15
-
16
-
17
-
18
-
19
-
20
-
21
-
22
-
23
-
24
-
25
-
26
-
27
-
28
-
29
-
30
-
31
-
32
-
33
-
34
-
35
-
36
-
37
-
38
-
39
-
40
-
41
-
42
-
43
-
44
-
45
-
46
-
47
-
48
-
49
-
50
-
51
-
52
-
53
-
54
-
55
-
56
-
57
-
58
-
59
-
60
-
61
-
62
-
63
-
64
-
65
-
66
-
67
-
68
-
69
-
70
-
71
-
72
-
73
-
74
-
75
-
76
-
77
-
78
-
79
-
80
-
81
-
82
-
83
-
84
-
85
-
86
-
87
-
88
-
89
-
90
-
91
-
92
-
93
-
94
-
95
-
96
-
97
-
98
-
99
-
100
-
101
-
102
-
103
-
104
-
105
-
106
-
107
-
108
-
109
-
110
-
111
-
112
-
113
-
114
-
115
-
116
-
117
-
118
-
119
-
120
-
121
-
122
-
123
-
124
-
125
-
126
-
127
-
128
-
129
-
130
-
131
-
132
-
 133
133 -
 134
134 -
 135
135 -
 136
136 -
 137
137 -
 138
138 -
 139
139 -
 140
140 -
 141
141 -
 142
142 -
 143
143 -
 144
144 -
 145
145 -
 146
146 -
 147
147 -
 148
148 -
 149
149 -
 150
150 -
 151
151 -
 152
152 -
 153
153 -
154
-
155
-
156
-
157
-
158
-
159
-
160
-
161
-
162
-
163
-
164
-
165
-
166
-
167
-
168
-
169
-
170
-
171
-
172
-
173
-
174
-
175
-
176
-
177
-
178
-
179
-
180
-
181
-
182
 |
 |

PART II
ITEM 8. Financial Statements and Supplementary Data
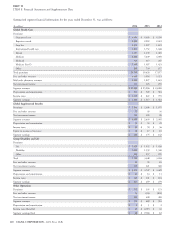
(In millions)
2014 2013 2012
Corporate
Other revenues and eliminations $ (16) $ (14) $ (24)
Net investment income 110 5
Segment revenues $ (15) $ (4) $ (19)
Depreciation and amortization $1$3$3
Income tax benefits $ (90) $ (110) $ (148)
Segment loss $ (265) $ (222) $ (329)
Realized investment gains
Realized investment gains $ 154 $ 213 $ 44
Income taxes 48 72 13
Realized investment gains, net of taxes $ 106 $ 141 $ 31
Total
Premiums $ 27,214 $ 25,575 $ 23,017
Fees and other revenues 4,141 3,601 3,291
Mail order pharmacy revenues 2,239 1,827 1,623
Net investment income 1,166 1,164 1,144
Realized investment gains 154 213 44
Total revenues $ 34,914 $ 32,380 $ 29,119
Depreciation and amortization $ 588 $ 597 $ 560
Income taxes $ 1,210 $ 698 $ 853
Segment earnings $ 1,996 $ 1,335 $ 1,592
Realized investment gains, net of taxes $ 106 $ 141 $ 31
Shareholders’ net income $ 2,102 $ 1,476 $ 1,623
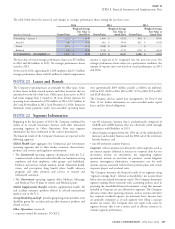
Revenue from external customers includes premiums, fees and other revenues, and mail order pharmacy revenues. The following table presents
these revenues by product type for the years ended December 31:
(In millions)
2014 2013 2012
Medical $ 24,476 $ 22,933 $ 20,973
Disability 1,767 1,616 1,413
Supplemental Health, Life, and Accident 4,739 4,322 3,680
Mail order pharmacy 2,239 1,827 1,623
Other 373 305 242
TOTAL $ 33,594 $ 31,003 $ 27,931
Foreign and U.S. revenues from external customers for the 3 years ended December 31 are shown below. In the periods shown, no foreign country
contributed more than 5% of consolidated revenues from external customers.
(In millions)
2014 2013 2012
U.S. $ 30,070 $ 27,868 $ 25,217
Foreign 3,524 3,135 2,714
TOTAL $ 33,594 $ 31,003 $ 27,931
As a percentage of consolidated revenues, premiums from CMS were 21% in 2014 and 22% in both 2013 and 2012. These amounts were
reported in the Global Health Care segment.
CIGNA CORPORATION - 2014 Form 10-K 111