Cigna 2014 Annual Report Download - page 128
Download and view the complete annual report
Please find page 128 of the 2014 Cigna annual report below. You can navigate through the pages in the report by either clicking on the pages listed below, or by using the keyword search tool below to find specific information within the annual report.-
 1
1 -
2
-
3
-
4
-
5
-
6
-
7
-
8
-
9
-
10
-
11
-
12
-
13
-
14
-
15
-
16
-
17
-
18
-
19
-
20
-
21
-
22
-
23
-
24
-
25
-
26
-
27
-
28
-
29
-
30
-
31
-
32
-
33
-
34
-
35
-
36
-
37
-
38
-
39
-
40
-
41
-
42
-
43
-
44
-
45
-
46
-
47
-
48
-
49
-
50
-
51
-
52
-
53
-
54
-
55
-
56
-
57
-
58
-
59
-
60
-
61
-
62
-
63
-
64
-
65
-
66
-
67
-
68
-
69
-
70
-
71
-
72
-
73
-
74
-
75
-
76
-
77
-
78
-
79
-
80
-
81
-
82
-
83
-
84
-
85
-
86
-
87
-
88
-
89
-
90
-
91
-
92
-
93
-
94
-
95
-
96
-
97
-
98
-
99
-
100
-
101
-
102
-
103
-
104
-
105
-
106
-
107
-
108
-
109
-
110
-
111
-
112
-
113
-
114
-
115
-
116
-
117
-
 118
118 -
 119
119 -
 120
120 -
 121
121 -
 122
122 -
 123
123 -
 124
124 -
 125
125 -
 126
126 -
 127
127 -
 128
128 -
 129
129 -
 130
130 -
 131
131 -
 132
132 -
 133
133 -
 134
134 -
 135
135 -
 136
136 -
 137
137 -
 138
138 -
139
-
140
-
141
-
142
-
143
-
144
-
145
-
146
-
147
-
148
-
149
-
150
-
151
-
152
-
153
-
154
-
155
-
156
-
157
-
158
-
159
-
160
-
161
-
162
-
163
-
164
-
165
-
166
-
167
-
168
-
169
-
170
-
171
-
172
-
173
-
174
-
175
-
176
-
177
-
178
-
179
-
180
-
181
-
182
 |
 |
PART II
ITEM 8. Financial Statements and Supplementary Data
portfolio loan review. The Company evaluates and monitors credit coverage and loan-to-value ratios. The debt service coverage ratio
quality on an ongoing basis, classifying each loan as a loan in good measures the amount of property cash flow available to meet annual
standing, potential problem loan or problem loan. interest and principal payments on debt, with a ratio below 1.0
indicating that there is not enough cash flow to cover the required
Quality ratings are based on our evaluation of a number of key inputs loan payments. The loan-to-value ratio, commonly expressed as a
related to the loan, including real estate market-related factors such as percentage, compares the amount of the loan to the fair value of the
rental rates and vacancies, and property-specific inputs such as growth underlying property collateralizing the loan.
rate assumptions and lease rollover statistics. However, the two most
significant contributors to the credit quality rating are the debt service
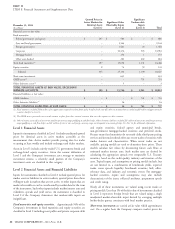
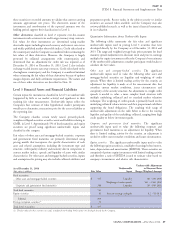
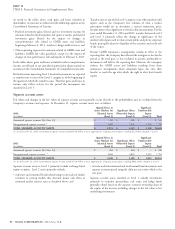
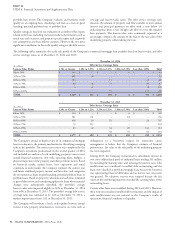
The following tables summarize the credit risk profile of the Company’s commercial mortgage loan portfolio based on loan-to-value and debt
service coverage ratios, as of December 31, 2014 and 2013:
December 31, 2014
Debt Service Coverage Ratio
(In millions)
Loan-to-Value Ratios 1.30x or Greater 1.20x to 1.29x 1.10x to 1.19x 1.00x to 1.09x Less than 1.00x Total
Below 50% $ 340 $ 17 $ – $ 6 $ – $ 363
50% to 59% 681 38 – – – 719
60% to 69% 394 – 15 – 60 469
70% to 79% 68 36 33 – 80 217
80% to 89% 6 41 – – 58 105
90% to 100% – – 55 – 153 208
TOTAL $ 1,489 $ 132 $ 103 $ 6 $ 351 $ 2,081
December 31, 2013
Debt Service Coverage Ratio
(In millions)
Loan-to-Value Ratios 1.30x or Greater 1.20x to 1.29x 1.10x to 1.19x 1.00x to 1.09x Less than 1.00x Total
Below 50% $ 314 $ – $ – $ 6 $ – $ 320
50% to 59% 581 131 – 18 – 730
60% to 69% 438 16 29 – 24 507
70% to 79% 79 113 – – – 192
80% to 89% 65 42 34 28 143 312
90% to 100% – – 58 50 83 191
TOTAL $ 1,477 $ 302 $ 121 $ 102 $ 250 $ 2,252
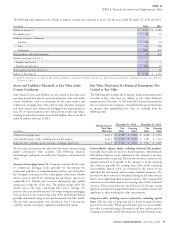
The Company’s annual in-depth review of its commercial mortgage delinquency or a borrower’s request for restructure causes
loan investments is the primary mechanism for identifying emerging management to believe that the Company’s estimate of financial
risks in the portfolio. The most recent review was completed by the performance, fair value or the risk profile of the underlying property
Company’s investment professionals in the second quarter of 2014 has been impacted.
and included an analysis of each underlying property’s most recent During 2013, the Company restructured its subordinate interest in
annual financial statements, rent rolls, operating plans, budgets, a two cross-collateralized pools of industrial loans totaling $31 million
physical inspection of the property and other pertinent factors. Based by extending the maturity dates and reducing the interest rates. This
on historical results, current leases, lease expirations and rental modification was considered a troubled debt restructuring and the
conditions in each market, the Company estimates the current year loans were classified as problem mortgage loans because the borrower
and future stabilized property income and fair value, and categorizes was experiencing financial difficulties and an interest rate concession
the investments as loans in good standing, potential problem loans or was granted. No valuation reserves were required because the fair
problem loans. Based on property valuations and cash flows estimated values of the underlying properties exceeded the carrying values of the
as part of this review, and considering updates for loans where material outstanding loans.
changes were subsequently identified, the portfolio’s average
loan-to-value ratio improved slightly to 63% at December 31, 2014 Certain other loans were modified during 2014 and 2013. However,
from 64% at December 31, 2013. The portfolio’s average debt service these were not considered troubled debt restructures and the impact of
coverage ratio was estimated to be 1.66 at December 31, 2014, a such modifications was not material to the Company’s results of
modest improvement from 1.62 at December 31, 2013. operations, financial condition or liquidity.
The Company will reevaluate a loan’s credit quality between annual
reviews if new property information is received or an event such as
96 CIGNA CORPORATION - 2014 Form 10-K