Cigna 2014 Annual Report Download - page 82
Download and view the complete annual report
Please find page 82 of the 2014 Cigna annual report below. You can navigate through the pages in the report by either clicking on the pages listed below, or by using the keyword search tool below to find specific information within the annual report.-
 1
1 -
2
-
3
-
4
-
5
-
6
-
7
-
8
-
9
-
10
-
11
-
12
-
13
-
14
-
15
-
16
-
17
-
18
-
19
-
20
-
21
-
22
-
23
-
24
-
25
-
26
-
27
-
28
-
29
-
30
-
31
-
32
-
33
-
34
-
35
-
36
-
37
-
38
-
39
-
40
-
41
-
42
-
43
-
44
-
45
-
46
-
47
-
48
-
49
-
50
-
51
-
52
-
53
-
54
-
55
-
56
-
57
-
58
-
59
-
60
-
61
-
62
-
63
-
64
-
65
-
66
-
67
-
68
-
69
-
70
-
71
-
 72
72 -
 73
73 -
 74
74 -
 75
75 -
 76
76 -
 77
77 -
 78
78 -
 79
79 -
 80
80 -
 81
81 -
 82
82 -
 83
83 -
 84
84 -
 85
85 -
 86
86 -
 87
87 -
 88
88 -
 89
89 -
 90
90 -
 91
91 -
 92
92 -
93
-
94
-
95
-
96
-
97
-
98
-
99
-
100
-
101
-
102
-
103
-
104
-
105
-
106
-
107
-
108
-
109
-
110
-
111
-
112
-
113
-
114
-
115
-
116
-
117
-
118
-
119
-
120
-
121
-
122
-
123
-
124
-
125
-
126
-
127
-
128
-
129
-
130
-
131
-
132
-
133
-
134
-
135
-
136
-
137
-
138
-
139
-
140
-
141
-
142
-
143
-
144
-
145
-
146
-
147
-
148
-
149
-
150
-
151
-
152
-
153
-
154
-
155
-
156
-
157
-
158
-
159
-
160
-
161
-
162
-
163
-
164
-
165
-
166
-
167
-
168
-
169
-
170
-
171
-
172
-
173
-
174
-
175
-
176
-
177
-
178
-
179
-
180
-
181
-
182
 |
 |

PART II
ITEM 7. Management’s Discussion and Analysis of Financial Condition and Results of Operations
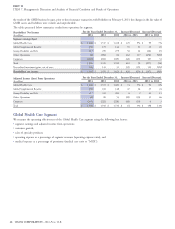
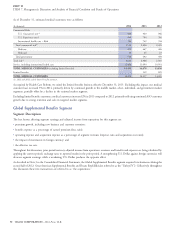
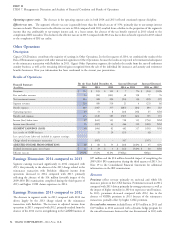
As of December 31, estimated medical customers were as follows:
(In thousands)
2014 2013 2012
Commercial Risk:
U.S. Guaranteed cost
(1)
930 960 946
U.S. Experience-rated 840 794 786
International health care – Risk 764 742 744
Total commercial risk
(1)
2,534 2,496 2,476
Medicare 459 467 426
Medicaid 59 25 23
Total government 518 492 449
Total risk
(1)
3,052 2,988 2,925
Service, including international health care 11,404 11,090 10,931
TOTAL MEDICAL CUSTOMERS (excluding limited benefits) 14,456 14,078 13,856
Limited benefits – 139 189
TOTAL MEDICAL CUSTOMERS 14,456 14,217 14,045
(1) 2013 and 2012 exclude limited benefits customers.
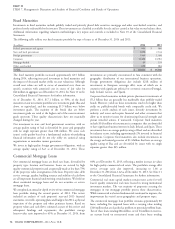
As required by Health Care Reform, we exited the limited benefits business effective December 31, 2013. Excluding this impact, our medical
customer base increased 3% in 2014, primarily driven by continued growth in the middle market, select, individual, and government market
segments, partially offset by a decline in the national market segment.
Excluding limited benefits customers, medical customers increased 2% in 2013 compared to 2012, primarily reflecting continued ASO customer
growth due to strong retention and sales in targeted market segments.
Global Supplemental Benefits Segment
Segment Description
The key factors affecting segment earnings and adjusted income from operations for this segment are:
premium growth, including new business and customer retention;
benefits expense as a percentage of earned premium (loss ratio);
operating expense and acquisition expense as a percentage of segment revenues (expense ratio and acquisition cost ratio);
the impact of movements in foreign currency; and
the effective tax rate.
Throughout this discussion, prior period currency adjusted income from operations, revenues, and benefits and expenses are being calculated by
applying the current period’s exchange rates to reported results in the prior period. A strengthening U.S. Dollar against foreign currencies will
decrease segment earnings, while a weakening U.S. Dollar produces the opposite effect.
As described in Note 3 to the Consolidated Financial Statements, the Global Supplemental Benefits segment acquired two businesses during the
second half of 2012: Great American Supplemental Benefits and Finans Emeklilik (also referred to as the ‘‘Turkey JV’’). Collectively, throughout
this discussion these two transactions are referred to as ‘‘the acquisitions.’’
50 CIGNA CORPORATION - 2014 Form 10-K
•
•
•
•
•