Cigna 2014 Annual Report Download - page 85
Download and view the complete annual report
Please find page 85 of the 2014 Cigna annual report below. You can navigate through the pages in the report by either clicking on the pages listed below, or by using the keyword search tool below to find specific information within the annual report.-
 1
1 -
2
-
3
-
4
-
5
-
6
-
7
-
8
-
9
-
10
-
11
-
12
-
13
-
14
-
15
-
16
-
17
-
18
-
19
-
20
-
21
-
22
-
23
-
24
-
25
-
26
-
27
-
28
-
29
-
30
-
31
-
32
-
33
-
34
-
35
-
36
-
37
-
38
-
39
-
40
-
41
-
42
-
43
-
44
-
45
-
46
-
47
-
48
-
49
-
50
-
51
-
52
-
53
-
54
-
55
-
56
-
57
-
58
-
59
-
60
-
61
-
62
-
63
-
64
-
65
-
66
-
67
-
68
-
69
-
70
-
71
-
72
-
73
-
74
-
 75
75 -
 76
76 -
 77
77 -
 78
78 -
 79
79 -
 80
80 -
 81
81 -
 82
82 -
 83
83 -
 84
84 -
 85
85 -
 86
86 -
 87
87 -
 88
88 -
 89
89 -
 90
90 -
 91
91 -
 92
92 -
 93
93 -
 94
94 -
 95
95 -
96
-
97
-
98
-
99
-
100
-
101
-
102
-
103
-
104
-
105
-
106
-
107
-
108
-
109
-
110
-
111
-
112
-
113
-
114
-
115
-
116
-
117
-
118
-
119
-
120
-
121
-
122
-
123
-
124
-
125
-
126
-
127
-
128
-
129
-
130
-
131
-
132
-
133
-
134
-
135
-
136
-
137
-
138
-
139
-
140
-
141
-
142
-
143
-
144
-
145
-
146
-
147
-
148
-
149
-
150
-
151
-
152
-
153
-
154
-
155
-
156
-
157
-
158
-
159
-
160
-
161
-
162
-
163
-
164
-
165
-
166
-
167
-
168
-
169
-
170
-
171
-
172
-
173
-
174
-
175
-
176
-
177
-
178
-
179
-
180
-
181
-
182
 |
 |
PART II
ITEM 7. Management’s Discussion and Analysis of Financial Condition and Results of Operations
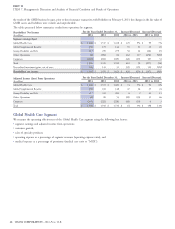
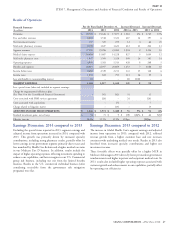
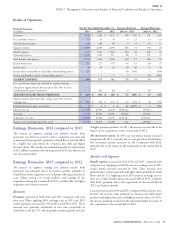
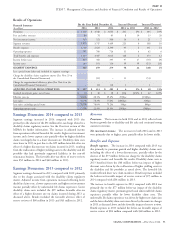
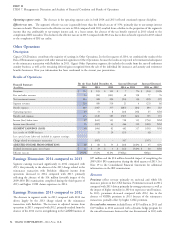
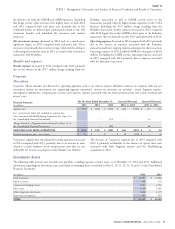
Results of Operations
For the Years Ended December 31, Increase/(Decrease) Increase/(Decrease)
Financial Summary
(In millions)
2014 2013 2012 2014 vs. 2013 2013 vs. 2012
Premiums $ 3,549 $ 3,348 $ 3,044 $ 201 6% $ 304 10%
Fees and other revenues 86 78 65 8 10 13 20
Net investment income 335 321 300 14 4 21 7
Segment revenues 3,970 3,747 3,409 223 6 338 10
Benefit expenses 2,716 2,621 2,290 95 4 331 14
Operating expenses 797 766 724 31 4 42 6
Total benefits and expenses 3,513 3,387 3,014 126 4 373 12
Income before taxes 457 360 395 97 27 (35) (9)
Income taxes 140 101 116 39 39 (15) (13)
SEGMENT EARNINGS 317 259 279 58 22 (20) (7)
Less: special items (after-tax) included in segment earnings:
Charge for disability claims regulatory matter (See Note 23 to
the Consolidated Financial Statements) – (51) – 51 (51)
Charge for organizational efficiency plans (See Note 6 to the
Consolidated Financial Statements) – (1) (2) 1 1
ADJUSTED INCOME FROM OPERATIONS $ 317 $ 311 $ 281 $ 6 2% $ 30 11%
Realized investment gains, net of taxes $ 14 $ 40 $ 18 $ (26) (65)% $ 22 122%
Effective tax rate 30.6% 28.1% 29.4% 250bps (130)bps
Loss ratio 76.5% 78.3% 75.2% (180)bps 310bps
Loss ratio, excluding special items 76.5% 76.0% 75.2% 50bps 80bps
Operating expense ratio 21.9% 22.4% 23.3% (50)bps (90)bps
Revenues
Earnings Discussion: 2014 compared to 2013
Premiums. The increases in both 2014 and in 2013 reflected new
Segment earnings increased in 2014 compared with 2013 due
business growth due to disability and life sales and continued strong
primarily to the absence of the $51 million after-tax charge related to a
customer retention.
disability claims regulatory matter. See the Overview section of this
MD&A for further information. The increase in adjusted income Net investment income. The increases in both 2014 and in 2013
from operations reflected favorable life results, higher net investment were primarily due to higher assets partially offset by lower yields.
income and a lower expense ratio partially offset by higher disability
claim costs largely due to a lower discount rate. Disability claim costs
Benefits and Expenses
were lower in 2013 in part due to the $29 million favorable after-tax Benefit expenses. The increase in 2014 compared with 2013 was
effect of a higher discount rate on claims incurred in 2013, resulting due primarily to premium growth and higher disability claims costs
from the reallocation of higher yielding assets to the disability and life including the effect of a lower discount rate, partially offset by the
portfolio that had previously supported liabilities in the run-off absence of the $77 million before-tax charge for the disability claims
reinsurance business. The favorable after-tax effects of reserve reviews regulatory matter and favorable life results. Disability claim costs in
were $52 million in 2014 and $60 million in 2013. 2013 benefited from the $40 million before-tax impact of higher
discount rates driven by the reallocation of higher yielding assets to
Earnings Discussion: 2013 compared to 2012
the disability and life portfolio as noted above. The favorable life
results reflected lower new claim incidence. Benefit expenses included
Segment earnings decreased in 2013 compared with 2012 primarily
the before-tax favorable impact of reserve reviews of $75 million in
due to the charge associated with the disability claims regulatory
2014 compared with $84 million in 2013.
matter. Adjusted income from operations increased reflecting lower
disability claim costs, a lower expense ratio and higher net investment The increase in benefit expenses in 2013 compared with 2012 was
income partially offset by unfavorable life claims experience. Lower primarily due to the $77 million before-tax impact of the disability
disability claim costs included the $29 million favorable after-tax claims regulatory matter, premium growth and unfavorable life claims
effect of a higher discount rate on claims incurred during 2013 as experience partially offset by lower disability claim costs. The
discussed above. Results included the favorable after-tax effect of unfavorable life claims experience was driven by higher new claim sizes
reserve reviews of $60 million in 2013 and $43 million in 2012. and the lower disability claim costs were driven by discount rate changes
in 2013 as discussed above and the favorable impact of reserve reviews.
Benefit expenses in 2013 included the before-tax favorable impact of
reserve reviews of $84 million compared with $60 million in 2012.
CIGNA CORPORATION - 2014 Form 10-K 53