Cigna 2014 Annual Report Download - page 132
Download and view the complete annual report
Please find page 132 of the 2014 Cigna annual report below. You can navigate through the pages in the report by either clicking on the pages listed below, or by using the keyword search tool below to find specific information within the annual report.-
 1
1 -
2
-
3
-
4
-
5
-
6
-
7
-
8
-
9
-
10
-
11
-
12
-
13
-
14
-
15
-
16
-
17
-
18
-
19
-
20
-
21
-
22
-
23
-
24
-
25
-
26
-
27
-
28
-
29
-
30
-
31
-
32
-
33
-
34
-
35
-
36
-
37
-
38
-
39
-
40
-
41
-
42
-
43
-
44
-
45
-
46
-
47
-
48
-
49
-
50
-
51
-
52
-
53
-
54
-
55
-
56
-
57
-
58
-
59
-
60
-
61
-
62
-
63
-
64
-
65
-
66
-
67
-
68
-
69
-
70
-
71
-
72
-
73
-
74
-
75
-
76
-
77
-
78
-
79
-
80
-
81
-
82
-
83
-
84
-
85
-
86
-
87
-
88
-
89
-
90
-
91
-
92
-
93
-
94
-
95
-
96
-
97
-
98
-
99
-
100
-
101
-
102
-
103
-
104
-
105
-
106
-
107
-
108
-
109
-
110
-
111
-
112
-
113
-
114
-
115
-
116
-
117
-
118
-
119
-
120
-
121
-
 122
122 -
 123
123 -
 124
124 -
 125
125 -
 126
126 -
 127
127 -
 128
128 -
 129
129 -
 130
130 -
 131
131 -
 132
132 -
 133
133 -
 134
134 -
 135
135 -
 136
136 -
 137
137 -
 138
138 -
 139
139 -
 140
140 -
 141
141 -
 142
142 -
143
-
144
-
145
-
146
-
147
-
148
-
149
-
150
-
151
-
152
-
153
-
154
-
155
-
156
-
157
-
158
-
159
-
160
-
161
-
162
-
163
-
164
-
165
-
166
-
167
-
168
-
169
-
170
-
171
-
172
-
173
-
174
-
175
-
176
-
177
-
178
-
179
-
180
-
181
-
182
 |
 |

PART II
ITEM 8. Financial Statements and Supplementary Data
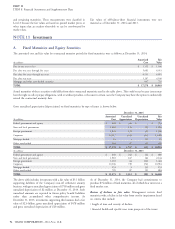
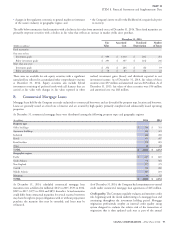
Investment Income and Gains and Losses
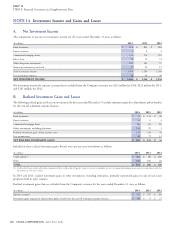
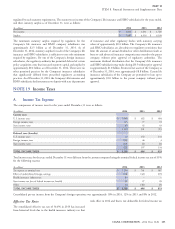
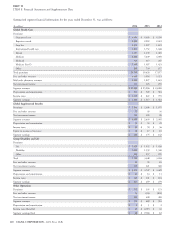
A. Net Investment Income
The components of pre-tax net investment income for the years ended December 31 were as follows:
(In millions)
2014 2013 2012
Fixed maturities $ 876 $ 823 $ 843
Equity securities 364
Commercial mortgage loans 133 174 192
Policy loans 72 74 74
Other long-term investments 105 101 57
Short-term investments and cash 17 22 14
Total investment income 1,206 1,200 1,184
Less investment expenses 40 36 40
NET INVESTMENT INCOME $ 1,166 $ 1,164 $ 1,144
Net investment income for separate accounts that is excluded from the Company’s revenues was $225 million for 2014, $232 million for 2013,
and $181 million for 2012.
B. Realized Investment Gains and Losses
The following realized gains and losses on investments for the years ended December 31 exclude amounts required to adjust future policy benefits
for the run-off settlement annuity business.
(In millions)
2014 2013 2012
Fixed maturities $14$113$48
Equity securities 13 8 4
Commercial mortgage loans (6) (3) (9)
Other investments, including derivatives 133 95 1
Realized investment gains, before income taxes 154 213 44
Less income taxes 48 72 13
NET REALIZED INVESTMENT GAINS $ 106 $ 141 $ 31
Included in these realized investment gains (losses) were pre-tax asset write-downs as follows:
(In millions)
2014 2013 2012
Credit related
(1)
$ (16) $ (8) $ (20)
Other (36) (21) (2)
TOTAL $ (52) $ (29) $ (22)
(1) Credit-related losses include other-than-temporary declines in fair value of equity securities, increases in valuation reserves on commercial mortgage loans and asset write-downs related to
investments in real estate entities.
In 2014 and 2013, realized investment gains in other investments, including derivatives, primarily represented gains on sale of real estate
properties held in joint ventures.
Realized investment gains that are excluded from the Company’s revenues for the years ended December 31 were as follows:
(In millions)
2014 2013 2012
Separate accounts $ 376 $ 417 $ 206
Investment gains required to adjust future policy benefits for the run-off settlement annuity business $ 86 $ 9 $ 21
100 CIGNA CORPORATION - 2014 Form 10-K
NOTE 14