Cigna 2014 Annual Report Download - page 79
Download and view the complete annual report
Please find page 79 of the 2014 Cigna annual report below. You can navigate through the pages in the report by either clicking on the pages listed below, or by using the keyword search tool below to find specific information within the annual report.-
 1
1 -
2
-
3
-
4
-
5
-
6
-
7
-
8
-
9
-
10
-
11
-
12
-
13
-
14
-
15
-
16
-
17
-
18
-
19
-
20
-
21
-
22
-
23
-
24
-
25
-
26
-
27
-
28
-
29
-
30
-
31
-
32
-
33
-
34
-
35
-
36
-
37
-
38
-
39
-
40
-
41
-
42
-
43
-
44
-
45
-
46
-
47
-
48
-
49
-
50
-
51
-
52
-
53
-
54
-
55
-
56
-
57
-
58
-
59
-
60
-
61
-
62
-
63
-
64
-
65
-
66
-
67
-
68
-
 69
69 -
 70
70 -
 71
71 -
 72
72 -
 73
73 -
 74
74 -
 75
75 -
 76
76 -
 77
77 -
 78
78 -
 79
79 -
 80
80 -
 81
81 -
 82
82 -
 83
83 -
 84
84 -
 85
85 -
 86
86 -
 87
87 -
 88
88 -
 89
89 -
90
-
91
-
92
-
93
-
94
-
95
-
96
-
97
-
98
-
99
-
100
-
101
-
102
-
103
-
104
-
105
-
106
-
107
-
108
-
109
-
110
-
111
-
112
-
113
-
114
-
115
-
116
-
117
-
118
-
119
-
120
-
121
-
122
-
123
-
124
-
125
-
126
-
127
-
128
-
129
-
130
-
131
-
132
-
133
-
134
-
135
-
136
-
137
-
138
-
139
-
140
-
141
-
142
-
143
-
144
-
145
-
146
-
147
-
148
-
149
-
150
-
151
-
152
-
153
-
154
-
155
-
156
-
157
-
158
-
159
-
160
-
161
-
162
-
163
-
164
-
165
-
166
-
167
-
168
-
169
-
170
-
171
-
172
-
173
-
174
-
175
-
176
-
177
-
178
-
179
-
180
-
181
-
182
 |
 |

PART II
ITEM 7. Management’s Discussion and Analysis of Financial Condition and Results of Operations
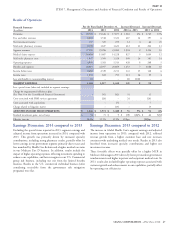
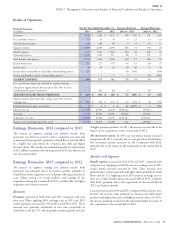
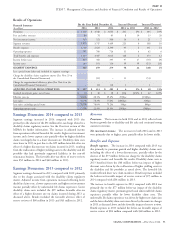
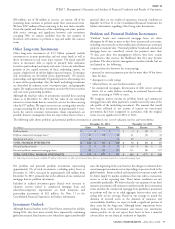
Results of Operations
For the Years Ended December 31, Increase/(Decrease) Increase/(Decrease)
Financial Summary
(In millions)
2014 2013 2012 2014 vs. 2013 2013 vs. 2012
Premiums $ 20,709 $ 19,626 $ 17,877 $ 1,083 6% $ 1,749 10%
Fees and other revenues 4,005 3,518 3,321 487 14 197 6
Net investment income 337 325 259 12 4 66 25
Mail order pharmacy revenues 2,239 1,827 1,623 412 23 204 13
Segment revenues 27,290 25,296 23,080 1,994 8 2,216 10
Medical claims expense 16,694 15,867 14,228 827 5 1,639 12
Mail order pharmacy costs 1,907 1,509 1,328 398 26 181 14
Operating expenses 6,009 5,581 5,313 428 8 268 5
Benefits and expenses 24,610 22,957 20,869 1,653 7 2,088 10
Income before taxes 2,680 2,339 2,211 341 15 128 6
Income taxes 1,035 822 793 213 26 29 4
Loss attributable to noncontrolling interest (1) – – (1) (100) – –
SEGMENT EARNINGS 1,646 1,517 1,418 129 9 99 7
Less: special items (after-tax) included in segment earnings:
Charge for organizational efficiency plan
(See Note 6 to the Consolidated Financial Statements) – (31) (42) 31 11
Costs associated with PBM services agreement – (24) – 24 (24)
Costs associated with acquisitions – – (7) – 7
Charge related to litigation matter – – (13) – 13
ADJUSTED INCOME FROM OPERATIONS $ 1,646 $ 1,572 $ 1,480 $ 74 5% $ 92 6%
Realized investment gains, net of taxes $ 54 $ 73 $ 9 $ (19) (26)% $ 64 N/M
Effective tax rate 38.6% 35.1% 35.9% 350bps (80)bps
Earnings Discussion: 2014 compared to 2013 Earnings Discussion: 2013 compared to 2012
Excluding the special items reported in 2013, segment earnings and The increase in Global Health Care’s segment earnings and adjusted
adjusted income from operations increased in 2014, compared with income from operations in 2013, compared with 2012, reflected
2013. This growth was primarily driven by increased specialty revenue growth from a higher customer base and rate increases
contributions, including strong pharmacy results, partially offset by consistent with underlying medical cost trends. Results in 2013 also
lower earnings in our government segment primarily due to taxes and benefited from increased specialty contributions and higher net
fees mandated by Health Care Reform and a higher medical care ratio investment income.
in our Medicare Part D business. In addition, results include the These favorable effects were partially offset by a higher MCR in
impact of higher operating expenses reflecting investment spending to Medicare Advantage in 2013 driven by lower per member government
enhance our capabilities, and lower margins in our U.S. Commercial reimbursements and higher inpatient and outpatient medical costs. In
group risk business, including our exit from the limited benefits 2013, results also included higher operating expenses associated with
business. Results in the U.S. commercial individual business (after customer growth and enhancements to our capabilities, partially offset
considering receivables from the government risk mitigation by operating cost efficiencies.
programs) were flat.
CIGNA CORPORATION - 2014 Form 10-K 47