Cigna 2014 Annual Report Download - page 78
Download and view the complete annual report
Please find page 78 of the 2014 Cigna annual report below. You can navigate through the pages in the report by either clicking on the pages listed below, or by using the keyword search tool below to find specific information within the annual report.-
 1
1 -
2
-
3
-
4
-
5
-
6
-
7
-
8
-
9
-
10
-
11
-
12
-
13
-
14
-
15
-
16
-
17
-
18
-
19
-
20
-
21
-
22
-
23
-
24
-
25
-
26
-
27
-
28
-
29
-
30
-
31
-
32
-
33
-
34
-
35
-
36
-
37
-
38
-
39
-
40
-
41
-
42
-
43
-
44
-
45
-
46
-
47
-
48
-
49
-
50
-
51
-
52
-
53
-
54
-
55
-
56
-
57
-
58
-
59
-
60
-
61
-
62
-
63
-
64
-
65
-
66
-
67
-
 68
68 -
 69
69 -
 70
70 -
 71
71 -
 72
72 -
 73
73 -
 74
74 -
 75
75 -
 76
76 -
 77
77 -
 78
78 -
 79
79 -
 80
80 -
 81
81 -
 82
82 -
 83
83 -
 84
84 -
 85
85 -
 86
86 -
 87
87 -
 88
88 -
89
-
90
-
91
-
92
-
93
-
94
-
95
-
96
-
97
-
98
-
99
-
100
-
101
-
102
-
103
-
104
-
105
-
106
-
107
-
108
-
109
-
110
-
111
-
112
-
113
-
114
-
115
-
116
-
117
-
118
-
119
-
120
-
121
-
122
-
123
-
124
-
125
-
126
-
127
-
128
-
129
-
130
-
131
-
132
-
133
-
134
-
135
-
136
-
137
-
138
-
139
-
140
-
141
-
142
-
143
-
144
-
145
-
146
-
147
-
148
-
149
-
150
-
151
-
152
-
153
-
154
-
155
-
156
-
157
-
158
-
159
-
160
-
161
-
162
-
163
-
164
-
165
-
166
-
167
-
168
-
169
-
170
-
171
-
172
-
173
-
174
-
175
-
176
-
177
-
178
-
179
-
180
-
181
-
182
 |
 |
PART II
ITEM 7. Management’s Discussion and Analysis of Financial Condition and Results of Operations
the results of the GMIB business because, prior to the reinsurance transaction with Berkshire on February 4, 2013, the changes in the fair value of
GMIB assets and liabilities were volatile and unpredictable.
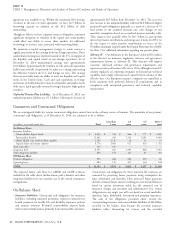
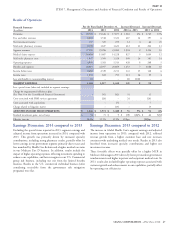
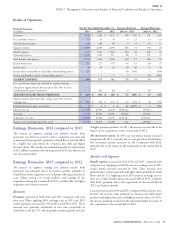
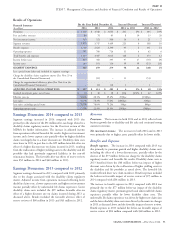
The tables presented below summarize results from operations by segment.
For the Years Ended December 31, Increase/(Decrease) Increase/(Decrease)
Shareholders’ Net Income
(In millions)
2014 2013 2012 2014 vs. 2013 2013 vs. 2012
Segment earnings (loss)
Global Health Care $ 1,646 $ 1,517 $ 1,418 $ 129 9% $ 99 7%
Global Supplemental Benefits 230 175 142 55 31 33 23
Group Disability and Life 317 259 279 58 22 (20) (7)
Other Operations 68 (394) 82 462 117 (476) N/M
Corporate (265) (222) (329) (43) (19) 107 33
Total 1,996 1,335 1,592 661 50 (257) (16)
Net realized investment gains, net of taxes 106 141 31 (35) (25) 110 N/M
Shareholders’ net income $ 2,102 $ 1,476 $ 1,623 $ 626 42% $ (147) (9)%
For the Years Ended December 31, Increase/(Decrease) Increase/(Decrease)
Adjusted Income (Loss) From Operations
(In millions)
2014 2013 2012 2014 vs. 2013 2013 vs. 2012
Global Health Care $ 1,646 $ 1,572 $ 1,480 $ 74 5% $ 92 6%
Global Supplemental Benefits 230 183 148 47 26 35 24
Group Disability and Life 317 311 281 6 2 30 11
Other Operations 68 88 53 (20) (23) 35 66
Corporate (265) (222) (228) (43) (19) 6 3
Total $ 1,996 $ 1,932 $ 1,734 $ 64 3% $ 198 11%
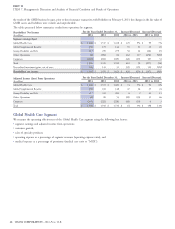
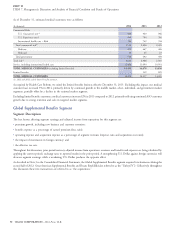
Global Health Care Segment
We measure the operating effectiveness of the Global Health Care segment using the following key factors:
segment earnings and adjusted income from operations;
customer growth;
sales of specialty products;
operating expense as a percentage of segment revenues (operating expense ratio); and
medical expense as a percentage of premiums (medical care ratio or ‘‘MCR’’).
46 CIGNA CORPORATION - 2014 Form 10-K
•
•
•
•
•