Cigna 2014 Annual Report Download - page 127
Download and view the complete annual report
Please find page 127 of the 2014 Cigna annual report below. You can navigate through the pages in the report by either clicking on the pages listed below, or by using the keyword search tool below to find specific information within the annual report.-
 1
1 -
2
-
3
-
4
-
5
-
6
-
7
-
8
-
9
-
10
-
11
-
12
-
13
-
14
-
15
-
16
-
17
-
18
-
19
-
20
-
21
-
22
-
23
-
24
-
25
-
26
-
27
-
28
-
29
-
30
-
31
-
32
-
33
-
34
-
35
-
36
-
37
-
38
-
39
-
40
-
41
-
42
-
43
-
44
-
45
-
46
-
47
-
48
-
49
-
50
-
51
-
52
-
53
-
54
-
55
-
56
-
57
-
58
-
59
-
60
-
61
-
62
-
63
-
64
-
65
-
66
-
67
-
68
-
69
-
70
-
71
-
72
-
73
-
74
-
75
-
76
-
77
-
78
-
79
-
80
-
81
-
82
-
83
-
84
-
85
-
86
-
87
-
88
-
89
-
90
-
91
-
92
-
93
-
94
-
95
-
96
-
97
-
98
-
99
-
100
-
101
-
102
-
103
-
104
-
105
-
106
-
107
-
108
-
109
-
110
-
111
-
112
-
113
-
114
-
115
-
116
-
 117
117 -
 118
118 -
 119
119 -
 120
120 -
 121
121 -
 122
122 -
 123
123 -
 124
124 -
 125
125 -
 126
126 -
 127
127 -
 128
128 -
 129
129 -
 130
130 -
 131
131 -
 132
132 -
 133
133 -
 134
134 -
 135
135 -
 136
136 -
 137
137 -
138
-
139
-
140
-
141
-
142
-
143
-
144
-
145
-
146
-
147
-
148
-
149
-
150
-
151
-
152
-
153
-
154
-
155
-
156
-
157
-
158
-
159
-
160
-
161
-
162
-
163
-
164
-
165
-
166
-
167
-
168
-
169
-
170
-
171
-
172
-
173
-
174
-
175
-
176
-
177
-
178
-
179
-
180
-
181
-
182
 |
 |
PART II
ITEM 8. Financial Statements and Supplementary Data
changes in the regulatory, economic or general market environment the Company’s intent to sell or the likelihood of a required sale prior
of the issuer’s industry or geographic region; and to recovery.
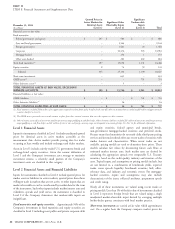
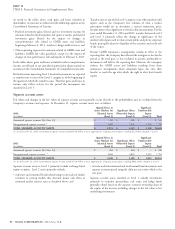
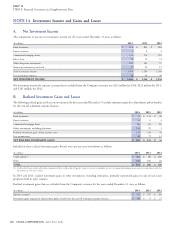
The table below summarizes fixed maturities with a decline in fair value from amortized cost as of December 31, 2014. These fixed maturities are
primarily corporate securities with a decline in fair value that reflects an increase in market yields since purchase.
December 31, 2014
Fair Amortized Unrealized Number
(Dollars in millions)
Value Cost Depreciation of Issues
Fixed maturities:
One year or less:
Investment grade $ 999 $ 1,010 $ (11) 251
Below investment grade $ 293 $ 307 $ (14) 236
More than one year:
Investment grade $ 256 $ 264 $ (8) 93
Below investment grade $ 78 $ 87 $ (9) 22
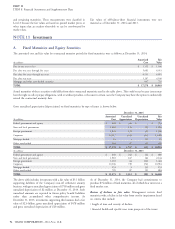
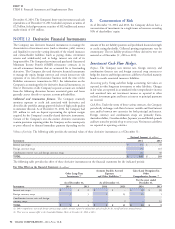
There were no available for sale equity securities with a significant realized investment gains (losses) and dividends reported in net
unrealized loss reflected in accumulated other comprehensive income investment income. As of December 31, 2014, fair values of these
at December 31, 2014. Equity securities also include hybrid securities were $57 million and amortized cost was $69 million. As of
investments consisting of preferred stock with call features that are December 31, 2013, fair values of these securities were $56 million
carried at fair value with changes in fair value reported in other and amortized cost was $68 million.
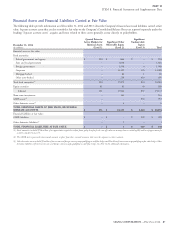
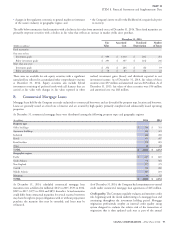
B. Commercial Mortgage Loans
Mortgage loans held by the Company are made exclusively to commercial borrowers and are diversified by property type, location and borrower.
Loans are generally issued at a fixed rate of interest and are secured by high quality, primarily completed and substantially leased operating
properties.
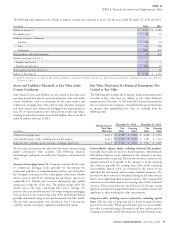
At December 31, commercial mortgage loans were distributed among the following property types and geographic regions:
(In millions)
2014 2013
Property type
Office buildings $ 700 $ 761
Apartment buildings 264 321
Industrial 466 450
Hotels 351 407
Retail facilities 272 285
Other 28 28
TOTAL $ 2,081 $ 2,252
Geographic region
Pacific $ 637 $ 805
South Atlantic 572 564
New England 277 379
Central 214 260
Middle Atlantic 287 201
Mountain 94 43
TOTAL $ 2,081 $ 2,252
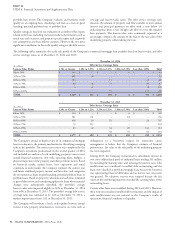
At December 31, 2014, scheduled commercial mortgage loan As of December 31, 2014, the Company had commitments to extend
maturities were as follows (in millions): $247 in 2015, $533 in 2016, credit under commercial mortgage loan agreements of $65 million.
$229 in 2017, $179 in 2018 and $893 thereafter. Actual maturities Credit quality. The Company regularly evaluates and monitors credit
could differ from contractual maturities for several reasons: borrowers risk, beginning with the initial underwriting of a mortgage loan and
may have the right to prepay obligations with or without prepayment continuing throughout the investment holding period. Mortgage
penalties; the maturity date may be extended; and loans may be origination professionals employ an internal credit quality rating
refinanced. system designed to evaluate the relative risk of the transaction at
origination that is then updated each year as part of the annual
CIGNA CORPORATION - 2014 Form 10-K 95
••