Cigna 2014 Annual Report Download - page 63
Download and view the complete annual report
Please find page 63 of the 2014 Cigna annual report below. You can navigate through the pages in the report by either clicking on the pages listed below, or by using the keyword search tool below to find specific information within the annual report.-
 1
1 -
2
-
3
-
4
-
5
-
6
-
7
-
8
-
9
-
10
-
11
-
12
-
13
-
14
-
15
-
16
-
17
-
18
-
19
-
20
-
21
-
22
-
23
-
24
-
25
-
26
-
27
-
28
-
29
-
30
-
31
-
32
-
33
-
34
-
35
-
36
-
37
-
38
-
39
-
40
-
41
-
42
-
43
-
44
-
45
-
46
-
47
-
48
-
49
-
50
-
51
-
52
-
 53
53 -
 54
54 -
 55
55 -
 56
56 -
 57
57 -
 58
58 -
 59
59 -
 60
60 -
 61
61 -
 62
62 -
 63
63 -
 64
64 -
 65
65 -
 66
66 -
 67
67 -
 68
68 -
 69
69 -
 70
70 -
 71
71 -
 72
72 -
 73
73 -
74
-
75
-
76
-
77
-
78
-
79
-
80
-
81
-
82
-
83
-
84
-
85
-
86
-
87
-
88
-
89
-
90
-
91
-
92
-
93
-
94
-
95
-
96
-
97
-
98
-
99
-
100
-
101
-
102
-
103
-
104
-
105
-
106
-
107
-
108
-
109
-
110
-
111
-
112
-
113
-
114
-
115
-
116
-
117
-
118
-
119
-
120
-
121
-
122
-
123
-
124
-
125
-
126
-
127
-
128
-
129
-
130
-
131
-
132
-
133
-
134
-
135
-
136
-
137
-
138
-
139
-
140
-
141
-
142
-
143
-
144
-
145
-
146
-
147
-
148
-
149
-
150
-
151
-
152
-
153
-
154
-
155
-
156
-
157
-
158
-
159
-
160
-
161
-
162
-
163
-
164
-
165
-
166
-
167
-
168
-
169
-
170
-
171
-
172
-
173
-
174
-
175
-
176
-
177
-
178
-
179
-
180
-
181
-
182
 |
 |

PART II
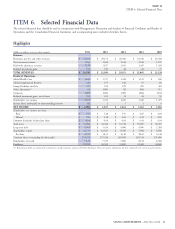
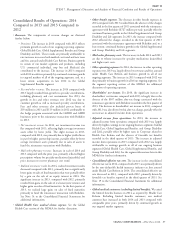
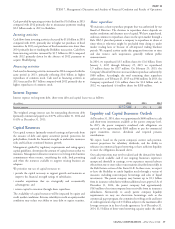
ITEM 6. Selected Financial Data
Selected Financial Data
The selected financial data should be read in conjunction with Management’s Discussion and Analysis of Financial Condition and Results of
Operations and the Consolidated Financial Statements and accompanying notes included elsewhere herein.
Highlights
(Dollars in millions, except per share amounts)
2014 2013 2012 2011 2010
Revenues
Premiums and fees and other revenues $ 31,355 $ 29,176 $ 26,308 $ 19,210 $ 18,528
Net investment income 1,166 1,164 1,144 1,146 1,105
Mail order pharmacy revenues 2,239 1,827 1,623 1,447 1,420
Realized investment gains 154 213 44 62 75
TOTAL REVENUES $ 34,914 $ 32,380 $ 29,119 $ 21,865 $ 21,128
Results of Operations:
Global Health Care $ 1,646 $ 1,517 $ 1,418 $ 1,105 $ 940
Global Supplemental Benefits 230 175 142 97 84
Group Disability and Life 317 259 279 295 305
Other Operations
(1)
68 (394) 82 (94) 111
Corporate (265) (222) (329) (184) (211)
Realized investment gains, net of taxes 106 141 31 41 50
Shareholders’ net income 2,102 1,476 1,623 1,260 1,279
Income (loss) attributable to noncontrolling interests (8) 2114
NET INCOME $ 2,094 $ 1,478 $ 1,624 $ 1,261 $ 1,283
Shareholders’ net income per share:
Basic $ 7.97 $ 5.28 $ 5.70 $ 4.65 $ 4.69
Diluted $ 7.83 $ 5.18 $ 5.61 $ 4.59 $ 4.65
Common dividends declared per share $ 0.04 $ 0.04 $ 0.04 $ 0.04 $ 0.04
Total assets $ 55,896 $ 54,336 $ 53,734 $ 50,697 $ 45,393
Long-term debt $ 5,005 $ 5,014 $ 4,986 $ 4,990 $ 2,288
Shareholders’ equity $ 10,774 $ 10,567 $ 9,769 $ 7,994 $ 6,356
Per share $ 41.55 $ 38.35 $ 34.18 $ 28.00 $ 23.38
Common shares outstanding (in thousands) 259,276 275,526 285,829 285,533 271,880
Shareholders of record 7,129 7,535 7,885 8,178 8,568
Employees 37,200 36,500 35,800 31,400 30,600
(1) Beginning in 2014, we combined the results of our run-off reinsurance segment with Other Operations. Prior year segment information has been conformed to the current year presentation.
CIGNA CORPORATION - 2014 Form 10-K 31
ITEM 6.