Cigna 2014 Annual Report Download - page 147
Download and view the complete annual report
Please find page 147 of the 2014 Cigna annual report below. You can navigate through the pages in the report by either clicking on the pages listed below, or by using the keyword search tool below to find specific information within the annual report.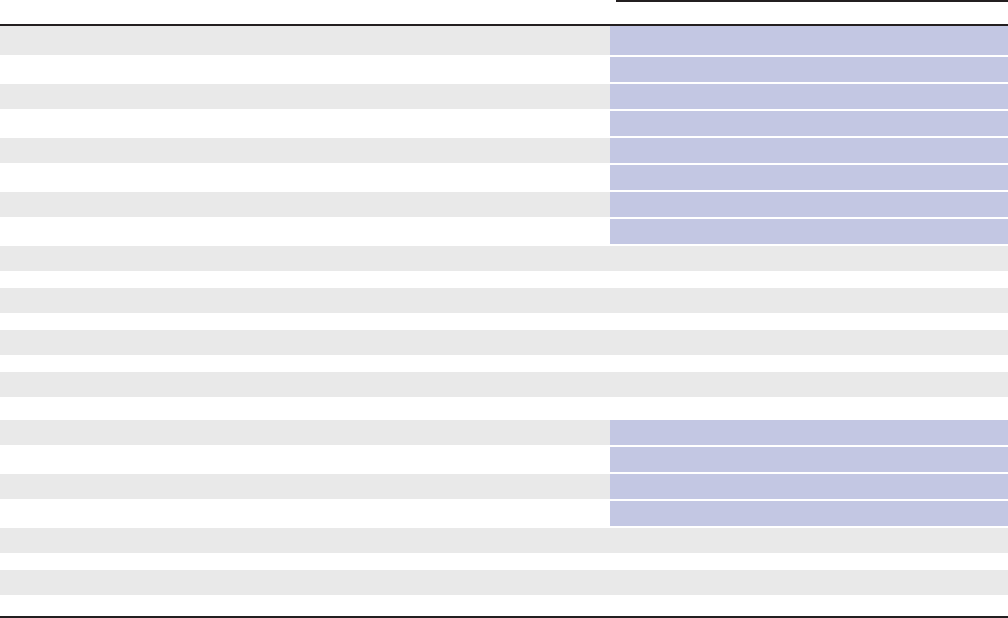
PART II
ITEM 8. Financial Statements and Supplementary Data
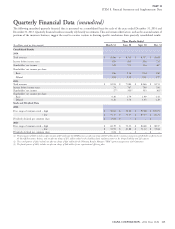
Quarterly Financial Data (unaudited)
The following unaudited quarterly financial data is presented on a consolidated basis for each of the years ended December 31, 2014 and
December 31, 2013. Quarterly financial results necessarily rely heavily on estimates. This and certain other factors, such as the seasonal nature of
portions of the insurance business, suggest the need to exercise caution in drawing specific conclusions from quarterly consolidated results.
Three Months Ended
(In millions, except per share amounts)
March 31 June 30 Sept. 30 Dec. 31
Consolidated Results
2014
Total revenues $ 8,496 $ 8,733 $ 8,757 $ 8,928
Income before income taxes 853 901 818 732
Shareholders’ net income 528 573 534 467
Shareholders’ net income per share:
Basic 1.96 2.16 2.04 1.80
Diluted 1.92 2.12 2.01 1.77
2013
Total revenues $ 8,183 $ 7,980 $ 8,066 $ 8,151
Income before income taxes 74 767 799 536
Shareholders’ net income 57
(1)
505
(2)
553 361
(3)
Shareholders’ net income per share:
Basic 0.20 1.79 1.99 1.32
Diluted 0.20 1.76 1.95 1.29
Stock and Dividend Data
2014
Price range of common stock – high $ 90.63 $ 93.20 $ 97.28 $ 105.73
– low $ 75.37 $ 73.47 $ 87.33 $ 85.75
Dividends declared per common share $ 0.04 $ – $ – $ –
2013
Price range of common stock – high $ 63.19 $ 73.13 $ 84.68 $ 88.57
– low $ 53.91 $ 61.88 $ 71.12 $ 72.64
Dividends declared per common share $ 0.04 $ – $ – $ –
(1) The first quarter of 2013 includes an after-tax gain of $25 million for the GMIB business, an after-tax charge of $507 million for the reinsurance transaction with Berkshire to effectively exit
the Run-off Reinsurance business, and an after-tax charge of $51 million related to the disability claims regulatory matter in the Group Disability and Life segment.
(2) The second quarter of 2013 includes an after-tax charge of $24 million for the Pharmacy Benefits Manager (‘‘PBM’’) partnering agreement with Catamaran.
(3) The fourth quarter of 2013 includes an after-tax charge of $40 million for an organizational efficiency plan.
CIGNA CORPORATION - 2014 Form 10-K 115


