Cigna 2014 Annual Report Download - page 81
Download and view the complete annual report
Please find page 81 of the 2014 Cigna annual report below. You can navigate through the pages in the report by either clicking on the pages listed below, or by using the keyword search tool below to find specific information within the annual report.-
 1
1 -
2
-
3
-
4
-
5
-
6
-
7
-
8
-
9
-
10
-
11
-
12
-
13
-
14
-
15
-
16
-
17
-
18
-
19
-
20
-
21
-
22
-
23
-
24
-
25
-
26
-
27
-
28
-
29
-
30
-
31
-
32
-
33
-
34
-
35
-
36
-
37
-
38
-
39
-
40
-
41
-
42
-
43
-
44
-
45
-
46
-
47
-
48
-
49
-
50
-
51
-
52
-
53
-
54
-
55
-
56
-
57
-
58
-
59
-
60
-
61
-
62
-
63
-
64
-
65
-
66
-
67
-
68
-
69
-
70
-
 71
71 -
 72
72 -
 73
73 -
 74
74 -
 75
75 -
 76
76 -
 77
77 -
 78
78 -
 79
79 -
 80
80 -
 81
81 -
 82
82 -
 83
83 -
 84
84 -
 85
85 -
 86
86 -
 87
87 -
 88
88 -
 89
89 -
 90
90 -
 91
91 -
92
-
93
-
94
-
95
-
96
-
97
-
98
-
99
-
100
-
101
-
102
-
103
-
104
-
105
-
106
-
107
-
108
-
109
-
110
-
111
-
112
-
113
-
114
-
115
-
116
-
117
-
118
-
119
-
120
-
121
-
122
-
123
-
124
-
125
-
126
-
127
-
128
-
129
-
130
-
131
-
132
-
133
-
134
-
135
-
136
-
137
-
138
-
139
-
140
-
141
-
142
-
143
-
144
-
145
-
146
-
147
-
148
-
149
-
150
-
151
-
152
-
153
-
154
-
155
-
156
-
157
-
158
-
159
-
160
-
161
-
162
-
163
-
164
-
165
-
166
-
167
-
168
-
169
-
170
-
171
-
172
-
173
-
174
-
175
-
176
-
177
-
178
-
179
-
180
-
181
-
182
 |
 |
PART II
ITEM 7. Management’s Discussion and Analysis of Financial Condition and Results of Operations
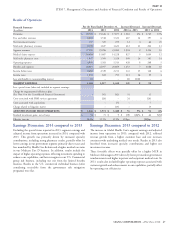
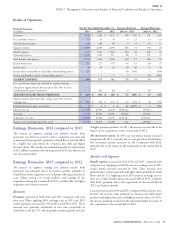
Medical claims expense. The 5% increase in 2014 compared with increase primarily reflects higher volume-related expenses and greater
2013 primarily reflects medical cost inflation and customer growth, spending to enhance our capabilities, partially offset by cost
partially offset by our exit from the limited benefits business. efficiencies.
Medical claims expense increased 12% in 2013 compared with 2012, Operating expenses increased 5% in 2013 compared with 2012,
primarily due to medical cost inflation, the timing of the primarily reflecting customer growth, increased spending to enhance
HealthSpring acquisition, and customer growth. Higher Medicare our capabilities, including costs associated with our new PBM
Advantage inpatient and outpatient medical costs also contributed to arrangement, and the timing of the HealthSpring acquisition,
the increase. partially offset by cost efficiencies.
The guaranteed cost medical care ratio increased slightly in 2014, The operating expense ratios, both including and excluding special
compared with 2013, due to a higher medical care ratio in the U.S. items, are essentially flat in 2014, compared with 2013. Excluding the
individual business and the exit from the limited benefits business, Health Care Reform taxes and fees that became effective in 2014, the
offset by rate increases to cover new taxes and fees mandated by operating expense ratios decreased in 2014 compared with 2013,
Health Care Reform. reflecting cost efficiencies and higher revenue, partially offset by
higher spending to enhance our capabilities.
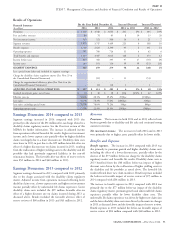
The Medicare Advantage medical care ratio decreased in 2014,
compared to 2013, reflecting improved per-customer revenues. The The operating expense ratios including and excluding special items
ratio increased in 2013, compared with 2012, driven by lower decreased in 2013, compared with 2012, primarily driven by revenue
government reimbursement rates as well as higher medical costs. growth and cost efficiencies partially offset by higher spending to
enhance our capabilities, including 2013 costs associated with our
The Medicare Part D medical care ratio increased in 2014, compared new PBM arrangement.
with 2013, primarily due to higher pharmacy costs including some
impact from the mix and channel of customer drug purchases as well Effective Tax Rates. The increase in the segment’s effective tax rate in
as increased specialty medication costs. 2014 compared with 2013 was attributable to the 2014 health
insurance industry tax that is not tax deductible. The slight decline in
Operating expenses. Operating expenses increased 8% in 2014 the effective tax rate in 2013 compared with 2012 primarily reflected
compared with 2013. Excluding the 2013 special items and the the recognition of tax benefits in certain of the segment’s foreign
Health Care Reform taxes and fees that became effective in 2014, operations.
operating expenses increased 3% in 2014 compared with 2013. The
Other Items Affecting Health Care Results
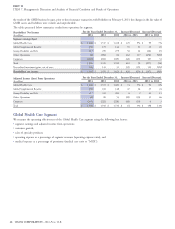
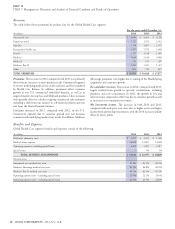
Global Health Care Medical Claims Payable
Medical claims payable increased 6% in 2014 compared with 2013, primarily driven by growth in the individual and stop loss books of business.
Medical claims payable increased 10% in 2013 compared with 2012, primarily reflecting growth in the stop loss and HealthSpring books of
business.
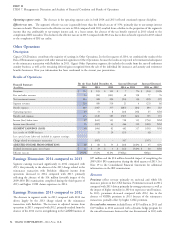
Medical Customers
A medical customer is defined as a person meeting any one of the following criteria:
is covered under an insurance policy or service agreement issued by the Company;
has access to the Company’s provider network for covered services under their medical plan; or
has medical claims that are administered by the Company.
CIGNA CORPORATION - 2014 Form 10-K 49
•
•
•