CarMax 2012 Annual Report Download - page 79
Download and view the complete annual report
Please find page 79 of the 2012 CarMax annual report below. You can navigate through the pages in the report by either clicking on the pages listed below, or by using the keyword search tool below to find specific information within the annual report.-
 1
1 -
2
-
3
-
4
-
5
-
6
-
7
-
8
-
9
-
10
-
11
-
12
-
13
-
14
-
15
-
16
-
17
-
18
-
19
-
20
-
21
-
22
-
23
-
24
-
25
-
26
-
27
-
28
-
29
-
30
-
31
-
32
-
33
-
34
-
35
-
36
-
37
-
38
-
39
-
40
-
41
-
42
-
43
-
44
-
45
-
46
-
47
-
48
-
49
-
50
-
51
-
52
-
53
-
54
-
55
-
56
-
57
-
58
-
59
-
60
-
61
-
62
-
63
-
64
-
65
-
66
-
67
-
68
-
 69
69 -
 70
70 -
 71
71 -
 72
72 -
 73
73 -
 74
74 -
 75
75 -
 76
76 -
 77
77 -
 78
78 -
 79
79 -
 80
80 -
 81
81 -
 82
82 -
 83
83 -
 84
84 -
 85
85 -
 86
86 -
 87
87 -
 88
88 -
 89
89 -
90
-
91
-
92
 |
 |

73
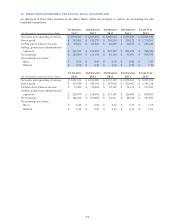
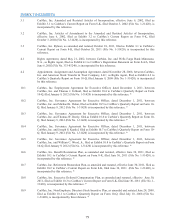
17. SELECTED QUARTERLY FINANCIAL DATA (UNAUDITED)
As discussed in Note 2(K), amounts in the tables below reflect the revisions to correct our accounting for sale-
leaseback transactions.
(In thousands, except per share data)
Net sales and operating revenues 2,679,417$ 2,587,819$ 2,260,514$ 2,475,849$ 10,003,599$
Gross profit 383,095$ 354,275$ 303,219$ 338,172$ 1,378,761$
CarMax Auto Finance income 69,661$ 63,826$ 62,625$ 66,073$ 262,185$
Selling, general and administrative
expenses 241,655$ 229,887$ 225,765$ 243,479$ 940,786$
Net earnings 125,500$ 111,154$ 82,110$ 95,031$ 413,795$
Net earnings per share:
Basic 0.56$ 0.49$ 0.36$ 0.42$ 1.83$
Diluted 0.54$ 0.48$ 0.36$ 0.41$ 1.79$
(In thousands, except per share data)
Net s ales and operating revenues 2,261,912$ 2,341,880$ 2,119,129$ 2,252,633$ 8,975,554$
Gross profit 333,548$ 349,118$ 297,910$ 320,652$ 1,301,228$
CarMax Auto Finance income 57,495$ 52,604$ 55,745$ 54,139$ 219,983$
Selling, general and administrative
expenses 220,079$ 218,664$ 213,156$ 226,906$ 878,805$
Net earnings 100,225$ 107,005$ 81,511$ 88,754$ 377,495$
Net earnings per share:
Basic 0.45$ 0.48$ 0.36$ 0.39$ 1.68$
Diluted 0.44$ 0.47$ 0.36$ 0.39$ 1.65$
1st Quarter 2nd Quarter 3rd Quarter 4th Quarter Fiscal Year
2011 2011 2011 2011 2011
1st Quarter 2nd Quarter 3rd Quarter 4th Quarter Fiscal Year
2012 2012 2012 2012 2012