CarMax 2012 Annual Report Download - page 30
Download and view the complete annual report
Please find page 30 of the 2012 CarMax annual report below. You can navigate through the pages in the report by either clicking on the pages listed below, or by using the keyword search tool below to find specific information within the annual report.-
 1
1 -
2
-
3
-
4
-
5
-
6
-
7
-
8
-
9
-
10
-
11
-
12
-
13
-
14
-
15
-
16
-
17
-
18
-
19
-
 20
20 -
 21
21 -
 22
22 -
 23
23 -
 24
24 -
 25
25 -
 26
26 -
 27
27 -
 28
28 -
 29
29 -
 30
30 -
 31
31 -
 32
32 -
 33
33 -
 34
34 -
 35
35 -
 36
36 -
 37
37 -
 38
38 -
 39
39 -
 40
40 -
41
-
42
-
43
-
44
-
45
-
46
-
47
-
48
-
49
-
50
-
51
-
52
-
53
-
54
-
55
-
56
-
57
-
58
-
59
-
60
-
61
-
62
-
63
-
64
-
65
-
66
-
67
-
68
-
69
-
70
-
71
-
72
-
73
-
74
-
75
-
76
-
77
-
78
-
79
-
80
-
81
-
82
-
83
-
84
-
85
-
86
-
87
-
88
-
89
-
90
-
91
-
92
 |
 |
24
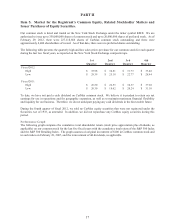
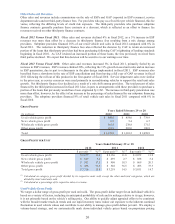
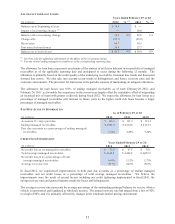
RETAIL VEHICLE SALES CHANGES
Vehicle units:
Used vehicles 3 % 11% 3 %
New vehicles (7)% 5% (29)%
Total 3 % 11% 2 %
Vehicle dollars:
Used vehicles 9 % 16% 9 %
New vehicles 1 % 6% (29)%
Total 8 % 16% 7 %
Ye ar s Ende d Fe br uar y 2 9 or 2 8
2012 2011 2010
Comparable store used unit sales growth is one of the key drivers of our profitability. A store is included in
comparable store retail sales in the store’s fourteenth full month of operation.
COMPARABLE STORE RETAIL VEHICLE SALES CHANGES
Vehicle units:
Used vehicles 1% 10% 1 %
New vehicles 1% 5% (29)%
Total 1% 10% 0 %
Vehicle dollars:
Used vehicles 7% 15% 6 %
New vehicles 9% 7% (29)%
Total 7% 15% 5 %
Ye ar s Ende d Fe br uar y 2 9 or 2 8
2012 2011 2010
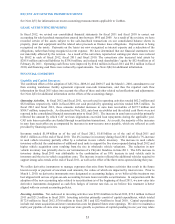
CHANGE IN USED CAR SUPERSTORE BASE
Used car superstores, beginning of year 103 100 100
Superstore openings 5 3 ʊ
Used car superstores, end of year 108 103 100
Ye ar s Ende d Fe br uar y 2 9 or 2 8
2012 2011 2010
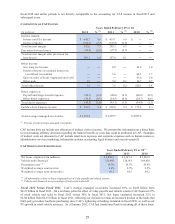
Used Vehicle Sales
Fiscal 2012 Versus Fiscal 2011. The 9% increase in used vehicle revenues in fiscal 2012 resulted from a 5% increase in
average retail selling price and a 3% increase in unit sales. The growth in the average retail selling price primarily
reflected increases in our acquisition costs, which resulted from the year-over-year increase in used vehicle wholesale
industry values. Used vehicle valuations remained strong in fiscal 2012 as the overall supply of used vehicles being
remarketed continued to be constrained following three years of new car industry sales at rates significantly below pre-
recession levels. A shift in our sales mix moderated the effect of higher acquisition costs on our average retail selling
price. During fiscal 2012, 5- to 10-year old vehicles, which generally have lower selling prices than later-model vehicles,
represented an increased portion of our sales mix. Our sales mix by make, model and vehicle age will vary from period to
period, reflecting changing consumer preferences.
The 3% increase in used unit sales included a 1% increase in comparable store used unit sales, together with sales from
superstores not yet included in the comparable store base. We believe the modest rate of comparable store used unit sales
growth reflected both a challenging sales comparison with fiscal 2011, when comparable store used unit sales increased
10%, and the continuation of weak economic conditions and low consumer confidence for much of the current fiscal
year. While customer traffic at comparable stores was higher than in the prior year, a larger portion of the current
year traffic represented customers who only obtained vehicle appraisals, which contributed to a decline in sales
conversion.
Our data indicated that we increased our share of the late model (0-to 6-year old) used vehicle market by
approximately 3% in fiscal 2012. We achieved market share growth despite a shift within the market for
0- to 6-year old vehicles towards older used vehicles and having fewer immature stores (those less than five years