CarMax 2012 Annual Report Download - page 73
Download and view the complete annual report
Please find page 73 of the 2012 CarMax annual report below. You can navigate through the pages in the report by either clicking on the pages listed below, or by using the keyword search tool below to find specific information within the annual report.-
 1
1 -
2
-
3
-
4
-
5
-
6
-
7
-
8
-
9
-
10
-
11
-
12
-
13
-
14
-
15
-
16
-
17
-
18
-
19
-
20
-
21
-
22
-
23
-
24
-
25
-
26
-
27
-
28
-
29
-
30
-
31
-
32
-
33
-
34
-
35
-
36
-
37
-
38
-
39
-
40
-
41
-
42
-
43
-
44
-
45
-
46
-
47
-
48
-
49
-
50
-
51
-
52
-
53
-
54
-
55
-
56
-
57
-
58
-
59
-
60
-
61
-
62
-
 63
63 -
 64
64 -
 65
65 -
 66
66 -
 67
67 -
 68
68 -
 69
69 -
 70
70 -
 71
71 -
 72
72 -
 73
73 -
 74
74 -
 75
75 -
 76
76 -
 77
77 -
 78
78 -
 79
79 -
 80
80 -
 81
81 -
 82
82 -
 83
83 -
84
-
85
-
86
-
87
-
88
-
89
-
90
-
91
-
92
 |
 |

67
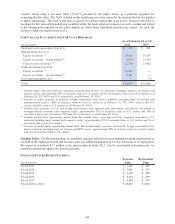
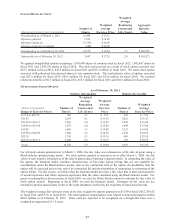
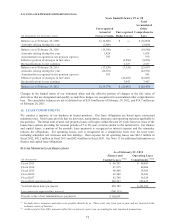
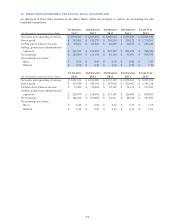
STOCK OPTION ACTIVITY
Outs tanding as of M arch 1, 2011 12,444 17.31$
Options granted 1,993 32.62$
Options exercised (1,519) 16.63$
Options forfeited or expired (340) 16.58$
Outs tanding as of February 29, 2012 12,578 19.84$ 3.7 $ 140,296
Exercisable as of February 29, 2012 7,667 17.25$ 2.8 $ 103,273
(Shares and intrinsic value in thousands)
Number of
Shares
Weighted
Average
Exercise Price
Weighted
Average
Remaining
Contractual
Life (Years )
Aggregate
Intr ins ic
Value
We granted nonqualified options to purchase 1,993,498 shares of common stock in fiscal 2012, 1,892,867 shares in
fiscal 2011 and 2,948,150 shares in fiscal 2010. The total cash received as a result of stock option exercises was
$25.3 million in fiscal 2012, $45.6 million in fiscal 2011 and $35.2 million in fiscal 2010. We settle stock option
exercises with authorized but unissued shares of our common stock. The total intrinsic value of options exercised
was $23.9 million for fiscal 2012, $41.6 million for fiscal 2011 and $25.8 million for fiscal 2010. We realized
related tax benefits of $9.5 million in fiscal 2012, $16.5 million for fiscal 2011 and $10.1 million for fiscal 2010.
OUTSTANDING STOCK OPTIONS
$ 7.14 to $10.75 543 1.1 7.31$ 543 7.31$
$11.43 2,294 4.1 11.43$ 1,023 11.43$
$13.19 to $14.13 1,510 3.0 13.45$ 1,509 13.45$
$14.49 to $19.36 1,472 2.0 15.85$ 1,444 15.88$
$19.82 1,685 3.1 19.82$ 1,223 19.82$
$19.98 to $24.99 1,282 2.2 24.78$ 1,248 24.91$
$25.39 1,743 5.1 25.39$ 485 25.39$
$25.67 to $33.11 2,049 6.0 32.37$ 192 29.95$
Total 12,578 3.7 19.84$ 7,667 17.25$
(Shares in thousands)
Range of Exercise Prices
Options Outstanding Options Exercisable
Number of
Shares
Weighted
Average
Remaining
Contractual
Life (Years)
Weighted
Average
Exercise
Price
Number of
Shares
Weighted
Average
Exercise Price
As of February 29, 2012
For all stock options granted prior to March 1, 2006, the fair value was estimated as of the date of grant using a
Black-Scholes option-pricing model. For stock options granted to associates on or after March 1, 2006, the fair
value of each award is estimated as of the date of grant using a binomial valuation model. In computing the value of
the option, the binomial model considers characteristics of fair-value option pricing that are not available for
consideration under the Black-Scholes model, such as the contractual term of the option, the probability that the
option will be exercised prior to the end of its contractual life and the probability of termination or retirement of the
option holder. For this reason, we believe that the binomial model provides a fair value that is more representative
of actual experience and future expected experience than the value calculated using the Black-Scholes model. For
grants to nonemployee directors prior to fiscal 2009, we used the Black-Scholes model to estimate the fair value of
stock option awards. Beginning in fiscal 2009, we used the binomial model. Estimates of fair value are not
intended to predict actual future events or the value ultimately realized by the recipients of share-based awards.
The weighted average fair value per share at the date of grant for options granted was $13.80 in fiscal 2012, $10.82
in fiscal 2011 and $5.30 in fiscal 2010. The unrecognized compensation costs related to nonvested options totaled
$28.2 million as of February 29, 2012. These costs are expected to be recognized on a straight-line basis over a
weighted average period of 1.9 years.