CarMax 2012 Annual Report Download - page 33
Download and view the complete annual report
Please find page 33 of the 2012 CarMax annual report below. You can navigate through the pages in the report by either clicking on the pages listed below, or by using the keyword search tool below to find specific information within the annual report.-
 1
1 -
2
-
3
-
4
-
5
-
6
-
7
-
8
-
9
-
10
-
11
-
12
-
13
-
14
-
15
-
16
-
17
-
18
-
19
-
20
-
21
-
22
-
 23
23 -
 24
24 -
 25
25 -
 26
26 -
 27
27 -
 28
28 -
 29
29 -
 30
30 -
 31
31 -
 32
32 -
 33
33 -
 34
34 -
 35
35 -
 36
36 -
 37
37 -
 38
38 -
 39
39 -
 40
40 -
 41
41 -
 42
42 -
 43
43 -
44
-
45
-
46
-
47
-
48
-
49
-
50
-
51
-
52
-
53
-
54
-
55
-
56
-
57
-
58
-
59
-
60
-
61
-
62
-
63
-
64
-
65
-
66
-
67
-
68
-
69
-
70
-
71
-
72
-
73
-
74
-
75
-
76
-
77
-
78
-
79
-
80
-
81
-
82
-
83
-
84
-
85
-
86
-
87
-
88
-
89
-
90
-
91
-
92
 |
 |
27
algorithms in order to appropriately balance sales trends, inventory turns and gross profit achievement. When
customer traffic and sales are consistently strong, we generally take fewer pricing markdowns, which in turn
benefits gross profit dollars per unit. When the sales pace slows, we may initially take more pricing markdowns,
which could pressure gross profit dollars per unit. However, as we are successful in reducing inventories to align
them with a slower sales pace, this may allow us to return to target levels of gross profit per unit. Other factors that
may influence gross profit include changes in our vehicle reconditioning costs, changes in the percentage of vehicles
sourced directly from consumers through our appraisal process and changes in the wholesale pricing environment.
Over the past several years, we have continued to refine our car-buying strategies, which we believe has benefited
used vehicle gross profit per unit.
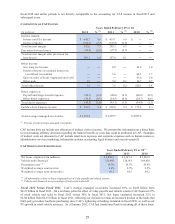
Fiscal 2012 Versus Fiscal 2011. Used vehicle gross profit increased $34.5 million, or 4%, to $888.6 million from
$854.0 million in fiscal 2011, reflecting the combination of the 3% increase in used unit sales and a 1%
improvement in gross profit per unit. Used vehicle gross profit per unit increased $21 to $2,177 per unit compared
with $2,156 per unit in fiscal 2011. Our shift to selling an increased mix of 5- to 10-year old vehicles in fiscal 2012
increased our average reconditioning cost per unit, as older vehicles typically require more reconditioning effort.
However, the older vehicles we sold were generally no less profitable than newer models.
In recent years, we have worked to eliminate waste from our vehicle reconditioning process through the emphasis on
the consistent application of reconditioning standards across our entire store base. Adjusting for the increase in
average age of vehicles reconditioned and sold in fiscal 2012, we sustained the $250 per unit savings achieved in
prior years.
Fiscal 2011 Versus Fiscal 2010. Used vehicle gross profit increased $114.2 million, or 15%, to $854.0 million
from $739.9 million in fiscal 2010, reflecting the combination of the 11% increase in used unit sales and a 4%
improvement in gross profit per unit. Used vehicle gross profit per unit increased $84 to $2,156 per unit compared
with $2,072 per unit in fiscal 2010.
The improvement in gross profit per unit resulted from a combination of factors, including benefits realized from
our ongoing initiatives to improve vehicle reconditioning efficiency and reduce waste, the support provided by the
strong wholesale pricing environment and a modest increase in the percentage of retail vehicles sourced directly
from consumers through our appraisal process. Vehicles purchased directly from consumers typically generate more
gross profit per unit compared with vehicles purchased at auction. As of the end of fiscal 2011, we estimated our
efforts to eliminate waste from our reconditioning processes in recent years have allowed us to achieve a sustainable
reduction in average reconditioning costs of approximately $250 per vehicle, on a cumulative basis.
New Vehicle Gross Profit
Fiscal 2012 Versus Fiscal 2011. New vehicle gross profit increased to $6.5 million from $5.4 million in fiscal
2011. The improvement was the result of a $188 increase in gross profit per unit to $847 per unit from $659 per unit
in fiscal 2011, partially offset by the 7% reduction in new vehicle unit sales. New vehicle gross profit per unit
benefited from a reduction in discounting by new car manufacturers and dealers in the months following the
earthquake and tsunami in Japan.
Fiscal 2011 Versus Fiscal 2010. New vehicle gross profit declined to $5.4 million from $6.7 million in fiscal 2010.
The reduction occurred as the benefit of the 5% increase in new vehicle unit sales was more than offset by a $199
reduction in gross profit per unit to $659 per unit from $858 per unit in fiscal 2010.
Wholesale Vehicle Gross Profit
Our wholesale vehicle gross profit has steadily increased over the last several years reflecting, in part, the benefits
realized from improvements and refinements in our car-buying strategies, appraisal delivery processes and in-store
auction processes. We have made continuous improvements in these processes, which we believe have allowed us
to become more efficient. Our in-store auctions have benefited from initiatives to increase our dealer-to-car ratio,
which we believe has allowed us to achieve higher prices. In addition, the frequency of our auctions, which are
generally held weekly or bi-weekly, minimizes the depreciation risk on these vehicles.
Fiscal 2012 Versus Fiscal 2011. Wholesale vehicle gross profit increased $63.0 million, or 26%, to $301.8 million
from $238.8 million in fiscal 2011. The improvement reflected the 20% increase in wholesale unit sales combined
with a 5% rise in wholesale vehicle gross profit per unit. Wholesale vehicle gross profit per unit increased $45 to
$953 per unit from $908 per unit in fiscal 2011. The year-over-year increase in industry pricing and strong dealer
demand contributed to the improved wholesale gross profit per unit.