CarMax 2012 Annual Report Download - page 2
Download and view the complete annual report
Please find page 2 of the 2012 CarMax annual report below. You can navigate through the pages in the report by either clicking on the pages listed below, or by using the keyword search tool below to find specific information within the annual report.-
 1
1 -
 2
2 -
 3
3 -
 4
4 -
 5
5 -
 6
6 -
 7
7 -
 8
8 -
 9
9 -
 10
10 -
 11
11 -
 12
12 -
 13
13 -
14
-
15
-
16
-
17
-
18
-
19
-
20
-
21
-
22
-
23
-
24
-
25
-
26
-
27
-
28
-
29
-
30
-
31
-
32
-
33
-
34
-
35
-
36
-
37
-
38
-
39
-
40
-
41
-
42
-
43
-
44
-
45
-
46
-
47
-
48
-
49
-
50
-
51
-
52
-
53
-
54
-
55
-
56
-
57
-
58
-
59
-
60
-
61
-
62
-
63
-
64
-
65
-
66
-
67
-
68
-
69
-
70
-
71
-
72
-
73
-
74
-
75
-
76
-
77
-
78
-
79
-
80
-
81
-
82
-
83
-
84
-
85
-
86
-
87
-
88
-
89
-
90
-
91
-
92
 |
 |
1 CarMax 2012
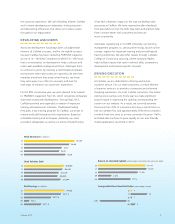
Fiscal 2012 was a year of preparing and investing for growth,
while maintaining an intense focus on building a better CarMax.
We reached some major milestones, including achieving over
$10 billion in revenues, selling more than 400,000 used vehicles
at retail and posting record earnings. Our diversified business
model enabled us to produce a 10% increase in net earnings
despite challenging market conditions that contributed to soft
comparable store used unit sales.
Both our wholesale and finance operations delivered
exceptional performance. Our wholesale auctions sold a
record 316,000 vehicles, representing a 20% increase in
unit sales, and achieved a 26% increase in gross profit.
CarMax Auto Finance (CAF) delivered income growth of
19% and ended the year with total managed receivables
of just under $5 billion.
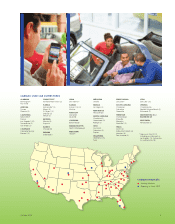
We are excited to be growing again. After suspending store
growth during fiscal 2009, and opening only 8 stores in
the last two fiscal years, we recently announced our plans to
open 40 to 55 stores over the next four years. This includes
10 stores in fiscal 2013 and between 10 and 15 stores
in each of the following three years.
We look forward to the significant opportunity ahead of us.
In addition to adding stores in new and existing markets,
we expect to continue to expand our market share as brand
awareness and consumer loyalty grow. Despite being the
largest retailer of used vehicles in the U.S., we estimate that
our market share of the 0- to 6-year old vehicle market is still
below 3% nationwide, and just 5% to 6% in those markets
we currently serve.
We are committed to ongoing improvement in every part
of our business. Our results throughout the challenging
environment of the recession demonstrated the power of a
focused effort to increase efficiency and continuously improve
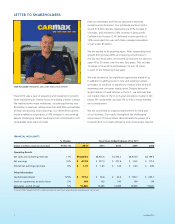
LETTER TO SHAREHOLDERS
TOM FOLLIARD PRESIDENT AND CHIEF EXECUTIVE OFFICER
FINANCIAL HIGHLIGHTS
% Change Fiscal Years Ended February 29 or 28
(1)
(Dollars in millions except per share data) ’11 to ’12 2012 2011 2010 2009 2008
Operating Results
Net sales and operating revenues 11% $10,003.6 $8,975.6 $7,470.2 $6,974.0 $8,199.6
Net earnings 10% $ 413.8 $ 377.5 $ 277.8 $ 55.2 $ 177.5
Diluted net earnings per share 8% $ 1.79 $ 1.65 $ 1.24 $ 0.25 $ 0.80
Other Information
Capital expenditures 125% $ 172.6 $ 76.6 $ 22.4 $ 185.7 $ 253.1
Used car superstores, at end of year 5% 108 103 100 100 89
Associates, at end of year 6% 16,460 15,565 13,439 13,035 15,637
(1) Fiscal 2008 through fiscal 2011 reflect revisions to correct our accounting for sale–leaseback transactions.