CarMax 2012 Annual Report Download - page 25
Download and view the complete annual report
Please find page 25 of the 2012 CarMax annual report below. You can navigate through the pages in the report by either clicking on the pages listed below, or by using the keyword search tool below to find specific information within the annual report.-
 1
1 -
2
-
3
-
4
-
5
-
6
-
7
-
8
-
9
-
10
-
11
-
12
-
13
-
14
-
 15
15 -
 16
16 -
 17
17 -
 18
18 -
 19
19 -
 20
20 -
 21
21 -
 22
22 -
 23
23 -
 24
24 -
 25
25 -
 26
26 -
 27
27 -
 28
28 -
 29
29 -
 30
30 -
 31
31 -
 32
32 -
 33
33 -
 34
34 -
 35
35 -
36
-
37
-
38
-
39
-
40
-
41
-
42
-
43
-
44
-
45
-
46
-
47
-
48
-
49
-
50
-
51
-
52
-
53
-
54
-
55
-
56
-
57
-
58
-
59
-
60
-
61
-
62
-
63
-
64
-
65
-
66
-
67
-
68
-
69
-
70
-
71
-
72
-
73
-
74
-
75
-
76
-
77
-
78
-
79
-
80
-
81
-
82
-
83
-
84
-
85
-
86
-
87
-
88
-
89
-
90
-
91
-
92
 |
 |

19
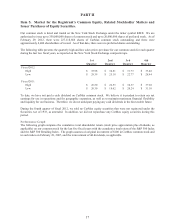
Item 6. Selected Financial Data.
(Dollars and shares in millions, except per share) FY12 FY11 (1)(2) FY10 (1) FY09 (1) FY08 (1) FY07 (1)
Income statement information
Used vehicle sales $ 7,826.9 $ 7,210.0 $ 6,192.3 $ 5,690.7 $ 6,589.3 $ 5,872.8
New vehicle sales 200.6 198.5 186.5 261.9 370.6 445.1
Wholesale vehicle sales 1,721.6 1,301.7 844.9 779.8 985.0 918.4
Other sales and revenues 254.5 265.3 246.6 241.6 254.6 229.3
Net sales and operating revenues 10,003.6 8,975.6 7,470.2 6,974.0 8,199.6 7,465.7
Gross profit 1,378.8 1,301.2 1,098.9 968.2 1,072.4 971.1
CarM ax Auto Finance income 262.2 220.0 175.2 15.3 85.9 132.6
SG&A 940.8 878.8 792.2 856.1 832.4 750.4
Interest exp ense 33.7 34.7 36.0 38.6 38.0 39.0
Earnings before income taxes 666.9 608.2 446.5 90.5 289.9 315.4
Income tax provision 253.1 230.7 168.6 35.2 112.5 122.0
Net earnings 413.8 377.5 277.8 55.2 177.5 193.4
S hare and per share information
Weighted average basic shares outstanding 226.3 223.4 219.5 217.5 216.0 212.5
Weighted average diluted shares outstanding 230.7 227.6 222.2 219.4 220.0 216.6
Basic net earnings p er share $ 1.83 $ 1.68 $ 1.25 $ 0.25 $ 0.82 $ 0.91
Diluted net earnings per share $ 1.79 $ 1.65 $ 1.24 $ 0.25 $ 0.80 $ 0.89
Balance sheet information
Total current assets $ 1,853.4 $ 1,410.1 $ 1,556.4 $ 1,287.8 $ 1,356.9 $ 1,150.5
Auto loan receivables, net 4,959.8 4,320.6 ʊ ʊ ʊ ʊ
Total assets 8,331.5 7,125.5 2,856.4 2,693.6 2,646.0 2,211.5
T otal current liabilities 646.3 522.7 490.5 502.7 500.7 521.4
Short-term debt and current portion:
Non-recourse notes pay able 174.3 132.5 ʊ ʊ ʊ ʊ
Other 15.1 13.6 133.6 168.2 108.6 158.3
Non-current debt:
Non-recourse notes pay able 4,509.8 3,881.1 ʊ ʊ ʊ ʊ
Other 353.6 367.6 378.5 539.6 581.3 395.8
Total shareholders’ equity 2,673.1 2,239.2 1,884.6 1,547.9 1,447.7 1,210.7
Unit sales information
Used vehicle units sold 408,080 396,181 357,129 345,465 377,244 337,021
Wholesale vehicle units sold 316,649 263,061 197,382 194,081 222,406 208,959
Pe rcent changes in
Comp arable store used vehicle unit sales 1 10 1 (16) 3 9
Total used vehicle unit sales 3 11 3 (8) 12 16
Wholesale vehicle unit sales 20 33 2 (13) 6 16
Net sales and operating revenues 11 20 7 (15) 10 19
Net earnings 10 36 403 (69) (8) 50
Diluted net earnings per share 8 33 396 (69) (10) 46
Other year-end information
Used car sup erstores 108 103 100 100 89 77
Associates 16,460 15,565 13,439 13,035 15,637 13,736
(1) As discussed in Note 2(K), amounts reflect the revisions to correct our accounting for sale-leaseback transactions.
(2) As discussed in Note 2(E), fiscal 2011 reflects the adoption of ASU Nos. 2009-16 and 2009-17 effective March 1, 2010.