CarMax 2012 Annual Report Download - page 74
Download and view the complete annual report
Please find page 74 of the 2012 CarMax annual report below. You can navigate through the pages in the report by either clicking on the pages listed below, or by using the keyword search tool below to find specific information within the annual report.-
 1
1 -
2
-
3
-
4
-
5
-
6
-
7
-
8
-
9
-
10
-
11
-
12
-
13
-
14
-
15
-
16
-
17
-
18
-
19
-
20
-
21
-
22
-
23
-
24
-
25
-
26
-
27
-
28
-
29
-
30
-
31
-
32
-
33
-
34
-
35
-
36
-
37
-
38
-
39
-
40
-
41
-
42
-
43
-
44
-
45
-
46
-
47
-
48
-
49
-
50
-
51
-
52
-
53
-
54
-
55
-
56
-
57
-
58
-
59
-
60
-
61
-
62
-
63
-
 64
64 -
 65
65 -
 66
66 -
 67
67 -
 68
68 -
 69
69 -
 70
70 -
 71
71 -
 72
72 -
 73
73 -
 74
74 -
 75
75 -
 76
76 -
 77
77 -
 78
78 -
 79
79 -
 80
80 -
 81
81 -
 82
82 -
 83
83 -
 84
84 -
85
-
86
-
87
-
88
-
89
-
90
-
91
-
92
 |
 |

68
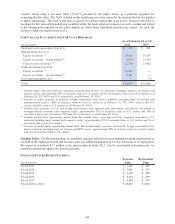
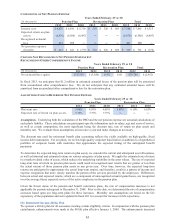
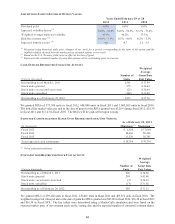
ASSUMPTIONS USED TO ESTIMATE OPTION VALUES
2012 2011 2010
Dividend yield10.0%0.0%0.0%
Expected v olatility factor (1) 34.8% - 52.0% 34.6% - 50.5% 52.2% - 73.4%
W eig h ted averag e exp ected v o latility149.3% 48.2% 57.3%
Ris k-free interes t rate (2) 0.01% - 3.5% 0.1% - 4.0% 0.2% - 3.2%
Expected term (in years) (3) 4.6 4.7 5.2 - 5.5
Years Ended February 29 or 28
(1) Measured using historical daily price changes of our stock for a period corresponding to the term of the option and the
implied volatility derived from the market prices of traded options on our stock.
(2) Based on the U.S. Treasury yield curve in effect at the time of grant.
(3) Represents the estimated number of years that options will be outstanding prior to exercise.
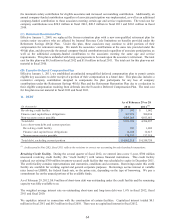
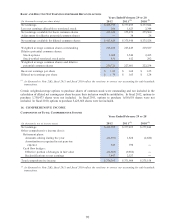
CASH-SETTLED RESTRICTED STOCK UNIT ACTIVITY
(Units in thousands)
Outs tanding as of March 1, 2011 1,501 17.49$
Stock units granted 575 32.69$
Stock units vested and converted (21) 20.64$
Stock units cancelled (140) 21.02$
Outs tanding as of February 29, 2012 1,915 21.76$
Number of
Uni ts
Weighted
Average
Grant Date
Fair Value
We granted RSUs of 575,380 units in fiscal 2012, 688,880 units in fiscal 2011 and 1,005,505 units in fiscal 2010.
The initial fair market value per unit at the date of grant for the RSUs granted was $32.69 during fiscal 2012, $25.39
in fiscal 2011 and $11.43 in fiscal 2010. The RSUs will be cash-settled upon vesting.
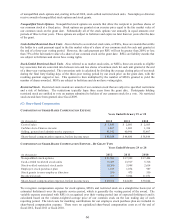
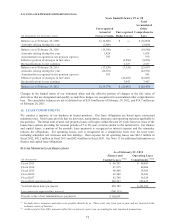
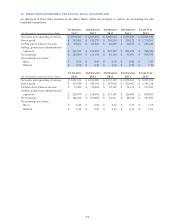
EXPECTED CASH SETTLEMENT RANGE UPON RESTRICTED STOCK UNIT VESTING
(In thousands)
Fis cal 2013 $ 6,624 $ 17,664
Fis cal 2014 10,616 28,309
Fis cal 2015 11,529 30,745
Total expected cash settlements $ 28,769 $ 76,718
Minimum (1) Maximum (1)
As of February 29, 2012
(1) Net of estimated forfeitures.
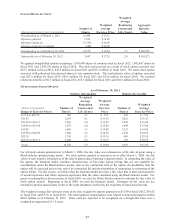
STOCK-SETTLED RESTRICTED STOCK UNIT ACTIVITY
(Units in thousands)
Outs tanding as of March 1, 2011 666 24.66$
Stock units granted 299 45.48$
Stock units vested and converted (2) 24.19$
Sto ck u nits cancelled (13) 31.02$
Outstanding as of February 29, 2012 950 31.12$
Number of
Uni ts
Weighted
Average
Grant Date
Fair Value
We granted MSUs of 299,102 units in fiscal 2012, 278,445 units in fiscal 2011 and 405,872 units in fiscal 2010. The
weighted average fair value per unit at the date of grant for MSUs granted was $45.48 in fiscal 2012, $36.28 in fiscal 2011
and $16.34 in fiscal 2010. The fair values were determined using a Monte-Carlo simulation and were based on the
expected market price of our common stock on the vesting date and the expected number of converted common shares.