CarMax 2012 Annual Report Download - page 68
Download and view the complete annual report
Please find page 68 of the 2012 CarMax annual report below. You can navigate through the pages in the report by either clicking on the pages listed below, or by using the keyword search tool below to find specific information within the annual report.-
 1
1 -
2
-
3
-
4
-
5
-
6
-
7
-
8
-
9
-
10
-
11
-
12
-
13
-
14
-
15
-
16
-
17
-
18
-
19
-
20
-
21
-
22
-
23
-
24
-
25
-
26
-
27
-
28
-
29
-
30
-
31
-
32
-
33
-
34
-
35
-
36
-
37
-
38
-
39
-
40
-
41
-
42
-
43
-
44
-
45
-
46
-
47
-
48
-
49
-
50
-
51
-
52
-
53
-
54
-
55
-
56
-
57
-
 58
58 -
 59
59 -
 60
60 -
 61
61 -
 62
62 -
 63
63 -
 64
64 -
 65
65 -
 66
66 -
 67
67 -
 68
68 -
 69
69 -
 70
70 -
 71
71 -
 72
72 -
 73
73 -
 74
74 -
 75
75 -
 76
76 -
 77
77 -
 78
78 -
79
-
80
-
81
-
82
-
83
-
84
-
85
-
86
-
87
-
88
-
89
-
90
-
91
-
92
 |
 |
62
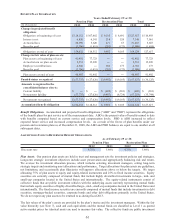
vehicles valued using a net asset value (“NAV”) provided by the plan’s trustee as a practical expedient for
measuring the fair value. The NAV is based on the underlying net assets owned by the fund divided by the number
of shares outstanding. The NAV’s unit price is quoted on a private market that is not active. However, the NAV is
based on the fair value of the underlying securities within the fund, which are traded on an active market and valued
at the closing price reported on the active market on which those individual securities are traded. As such, the
collective funds are classified as Level 2.
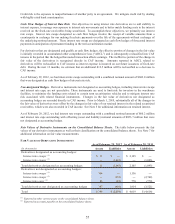
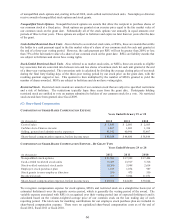
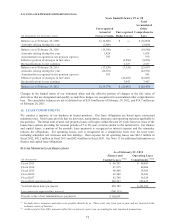
FAIR VALUE OF PLAN ASSETS AND FAIR VALUE HIERARCHY
(In thousands)
Cash and cash equivalents (Level 1) 595$ 421$
Mutual funds (Level 1):
Equity securities (1) 24,410 58,197
Equity securities – international (2) 4,078 11,395
Fixed income securities (3) 22,750 21,482
Collective funds (Level 2):
Equity securities (4) 36,803 ʊ
Equity securities – international (5) 8,261 ʊ
Investment payables, net ʊ (3)
Total 96,897$ 91,492$
As of February 29 or 28
2012 2011
(1) Includes large-, mid- and small-cap companies primarily from diverse U.S. industries including computer, oil and gas and
internet sectors; approximately 95% of securities relate to U.S. entities and 5% of securities relate to non-U.S. entities as of
February 29, 2012 (85% and 15%, respectively, as of February 28, 2011) .
(2) Consists of equity securities of primarily foreign corporations from diverse industries including bank, oil and gas and
pharmaceutical sectors; 100% of securities relate to non-U.S. entities as of February 29, 2012 (90% relate to non-U.S.
entities and 10% relate to U.S. entities, as of February 28, 2011).
(3) Includes debt securities of U.S. and foreign governments, their agencies and corporations, and diverse investments in
mortgage-backed securities and corporate bonds; approximately 70% of securities relate to U.S. entities and 30% of
securities relate to non-U.S. entities (75% and 25%, respectively, as of February 28, 2011).
(4) Includes pooled funds representing mutual funds that include large-, mid- and small-cap companies from diverse U.S.
industries including bank, internet and computer sectors; approximately 95% of securities relate to U.S. entities and 5% of
securities relate to non-U.S. entities.
(5) Consists of pooled funds representing mutual funds that include equity securities of primarily foreign corporations from
diverse industries including bank, oil and gas and REIT sectors; approximately 90% of securities relate to non-U.S. entities
and 10% of securities relate to U.S. entities.
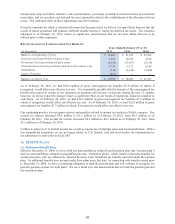
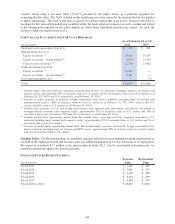
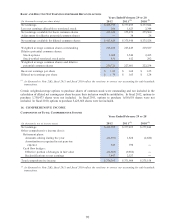
Funding Policy. For the pension plan, we contribute amounts sufficient to meet minimum funding requirements as
set forth in the employee benefit and tax laws, plus any additional amounts as we may determine to be appropriate.
We expect to contribute $7.2 million to the pension plan in fiscal 2013. For the non-funded restoration plan, we
contribute an amount equal to the benefit payments.
ESTIMATED FUTURE BENEFIT PAYMENTS
(In thousands)
Fiscal 2013 1,669$ 409$
Fiscal 2014 2,001$ 475$
Fiscal 2015 2,308$ 489$
Fiscal 2016 2,624$ 499$
2,959$ 507$
20,847$ 2,856$
Pens ion Res toration
Plan Plan
Fiscal 2017
Fiscal 2018 to 2022