CarMax 2012 Annual Report Download - page 51
Download and view the complete annual report
Please find page 51 of the 2012 CarMax annual report below. You can navigate through the pages in the report by either clicking on the pages listed below, or by using the keyword search tool below to find specific information within the annual report.-
 1
1 -
2
-
3
-
4
-
5
-
6
-
7
-
8
-
9
-
10
-
11
-
12
-
13
-
14
-
15
-
16
-
17
-
18
-
19
-
20
-
21
-
22
-
23
-
24
-
25
-
26
-
27
-
28
-
29
-
30
-
31
-
32
-
33
-
34
-
35
-
36
-
37
-
38
-
39
-
40
-
 41
41 -
 42
42 -
 43
43 -
 44
44 -
 45
45 -
 46
46 -
 47
47 -
 48
48 -
 49
49 -
 50
50 -
 51
51 -
 52
52 -
 53
53 -
 54
54 -
 55
55 -
 56
56 -
 57
57 -
 58
58 -
 59
59 -
 60
60 -
 61
61 -
62
-
63
-
64
-
65
-
66
-
67
-
68
-
69
-
70
-
71
-
72
-
73
-
74
-
75
-
76
-
77
-
78
-
79
-
80
-
81
-
82
-
83
-
84
-
85
-
86
-
87
-
88
-
89
-
90
-
91
-
92
 |
 |

45
Goodwill and Intangible Assets. Goodwill and other intangibles had a carrying value of $10.1 million as of
February 29, 2012 and February 28, 2011. We review goodwill and intangible assets for impairment annually or
when circumstances indicate the carrying amount may not be recoverable. No impairment of goodwill or intangible
assets resulted from our annual impairment tests in fiscal 2012, fiscal 2011 or fiscal 2010.
Restricted Cash on Deposit in Reserve Accounts. The restricted cash on deposit in reserve accounts is for the
benefit of the securitization investors. In the event that the cash generated by the securitized receivables in a given
period was insufficient to pay the interest, principal and other required payments, the balances on deposit in the
reserve accounts would be used to pay those amounts. These funds are restricted for the benefit of holders of non-
recourse notes payable and are not expected to be available to the company or its creditors. Restricted cash on
deposit in reserve accounts was $45.3 million as of February 29, 2012, and $45.0 million as of February 28, 2011.
See Note 5 for additional information on securitizations.
Restricted Investments. Restricted investments includes money market securities primarily associated with certain
insurance programs and mutual funds held in a rabbi trust established in May 2011 to fund informally our executive
deferred compensation plan. Due to the short-term nature and/or variable rates associated with these financial
instruments, the carrying value approximates fair value. Restricted investments totaled $31.4 million as of
February 29, 2012, and $26.7 million as of February 28, 2011.
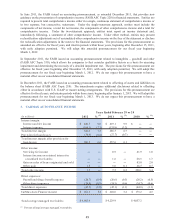
(K) Finance Lease Obligations
We revised our consolidated financial statements for fiscal 2011 and 2010 to correct our accounting for sale-
leasebacks transactions. The revisions resulted from the misapplication of the sale-leaseback provisions of FASB
ASC Topic 840, Leases, related to transactions we entered into between fiscal 1995 and 2009. We determined that
our financial statements were not materially affected by the correction.
The related lease agreements give us the ability, by exercising renewal options, to extend the leases to cover
substantially all of the lease assets’ useful lives at fixed payment terms. This type of renewal is generally considered
a form of “continuing involvement,” which should have precluded us from derecognizing certain of the related
assets from our consolidated balance sheets.
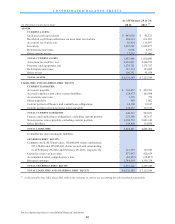
To correct our accounting for these sale-leaseback transactions, we used the financing method where we recorded
certain of the assets subject to the sale-leasebacks on our consolidated balance sheets in property, plant and
equipment and the related sales proceeds as finance lease obligations. Depreciation is being recognized on the
assets. Payments on the leases are now recognized as interest expense and a reduction of the obligations, rather than
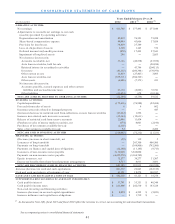
being recognized as rent expense. The revisions resulted in a net increase in cash flows from operating activities
with an equal net decrease in cash flows from financing activities. The following tables summarize the impacts of
the revisions on the major financial statement line items for the respective periods.
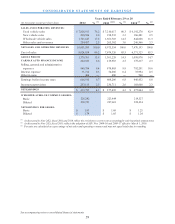
CONSOLIDATED STATEMENTS OF EARNINGS
(In thousands except per share data)
Selling, general and administrative expenses 905,091$ (26,286)$ 878,805$
Interes t expense 3,110$ 31,570$ 34,680$
Earnings before income taxes 613,490$ (5,284)$ 608,206$
Income tax provis ion 232,612$ (1,901)$ 230,711$
Net earnings 380,878$ (3,383)$ 377,495$
Net Earnings Per Share:
Bas ic 1.70$ (0.02)$ 1.68$
Diluted 1.67$ (0.02)$ 1.65$
Ye ar Ende d Fe br uar y 2 8 , 2 0 1 1
Reported Adjustments Revised
Previously