CarMax 2012 Annual Report Download - page 32
Download and view the complete annual report
Please find page 32 of the 2012 CarMax annual report below. You can navigate through the pages in the report by either clicking on the pages listed below, or by using the keyword search tool below to find specific information within the annual report.-
 1
1 -
2
-
3
-
4
-
5
-
6
-
7
-
8
-
9
-
10
-
11
-
12
-
13
-
14
-
15
-
16
-
17
-
18
-
19
-
20
-
21
-
 22
22 -
 23
23 -
 24
24 -
 25
25 -
 26
26 -
 27
27 -
 28
28 -
 29
29 -
 30
30 -
 31
31 -
 32
32 -
 33
33 -
 34
34 -
 35
35 -
 36
36 -
 37
37 -
 38
38 -
 39
39 -
 40
40 -
 41
41 -
 42
42 -
43
-
44
-
45
-
46
-
47
-
48
-
49
-
50
-
51
-
52
-
53
-
54
-
55
-
56
-
57
-
58
-
59
-
60
-
61
-
62
-
63
-
64
-
65
-
66
-
67
-
68
-
69
-
70
-
71
-
72
-
73
-
74
-
75
-
76
-
77
-
78
-
79
-
80
-
81
-
82
-
83
-
84
-
85
-
86
-
87
-
88
-
89
-
90
-
91
-
92
 |
 |

26
Other Sales and Revenues
Other sales and revenues include commissions on the sale of ESPs and GAP (reported in ESP revenues), service
department sales and net third-party finance fees. For providers who pay us a fixed fee per vehicle financed, this fee
varies, reflecting the differing levels of credit risk exposure. The third-party providers who purchase subprime
finance contracts generally purchase these contracts at a discount, which is reflected as an offset to finance fee
revenues received on other third-party finance contracts.
Fiscal 2012 Versus Fiscal 2011. Other sales and revenues declined 4% in fiscal 2012, as a 3% increase in ESP
revenues was more than offset by a decrease in third-party finance fees resulting from a mix change among
providers. Subprime providers financed 10% of our retail vehicle unit sales in fiscal 2012 compared with 8% in
fiscal 2011. The reduction in third-party finance fees also reflected the decision by CAF to retain an increased
portion of the loans that third-party providers had been purchasing following CAF’s tightening of lending standards
beginning in fiscal 2010. As CAF retained an increased portion of these loans, the fees previously received from
third parties declined. We expect that this decision will be accretive to our earnings over time.
Fiscal 2011 Versus Fiscal 2010. Other sales and revenues increased 8% in fiscal 2011, primarily fueled by an
increase in ESP revenues. ESP revenues climbed 20%, reflecting the 11% growth in used unit sales and an increase
in ESP penetration, due in part to refinements in the plan design implemented in fiscal 2011. ESP revenues also
benefited from a slowdown in the rate of ESP cancellations and from having a full year of GAP revenues in fiscal
2011 following the roll out of this product in the first quarter of fiscal 2010. Service department sales were similar
to the prior year, as service resources were used primarily in reconditioning vehicles to support the retail unit sales
growth. Net third-party finance fees declined as a result of a mix shift among providers. The total percent of sales
financed by the third parties increased in fiscal 2011 due, in part, to arrangements with these providers to purchase a
portion of the loans that previously would have been originated by CAF. The increase in third-party penetration was
more than offset, however, by the effect of an increase in the percentage of sales financed by our subprime financing
providers. The subprime providers financed 8% of retail vehicle unit sales in fiscal 2011 compared with 6% in
fiscal 2010.
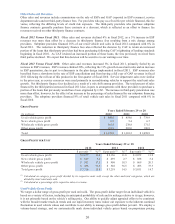
GROSS PROFIT
(In millions)
Used vehicle gross profit 888.6$ 854.0$ 739.9$
New vehicle gross profit 6.5 5.4 6.7
Wholesale vehicle gross profit 301.8 238.8 171.5
Other gross profit 181.9 203.0 180.8
Total 1,378.8$ 1,301.2$ 1,098.9$
2010
Year s Ende d Fe br uar y 2 9 or 2 8
2012 2011
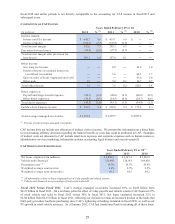
GROSS PROFIT PER UNIT
%(2) %(2) %(2)
Used vehicle gross profit 2,177$ 11.4 2,156$ 11.8 2,072$ 11.9
New vehicle gross profit 847$ 3.2 659$ 2.7 858$ 3.6
Wholesale vehicle gross profit 953$ 17.5 908$ 18.3 869$ 20.3
Other gross profit 438$ 71.5 502$ 76.5 495$ 73.3
Total gross profit 3,316$ 13.8 3,218$ 14.5 3,011$ 14.7
2010
$ per unit (1) $ per unit (1) $ per unit (1)
Years Ended February 29 or 28
2012 2011
(1) Calculated as category gross profit divided by its respective units sold, except the other and total categories, which are
divided by total retail units sold.
(2) Calculated as a percentage of its respective sales or revenue.
Used Vehicle Gross Profit
We target a dollar range of gross profit per used unit sold. The gross profit dollar target for an individual vehicle is
based on a variety of factors, including its anticipated probability of sale and its mileage relative to its age; however,
it is not primarily based on the vehicle’s selling price. Our ability to quickly adjust appraisal offers to be consistent
with the broader market trade-in trends and our rapid inventory turns reduce our exposure to the inherent continual
fluctuation in used vehicle values and contribute to our ability to manage gross profit dollars per unit. We employ a
volume-based strategy, and we systematically mark down individual vehicle prices based on proprietary pricing