CarMax 2012 Annual Report Download - page 37
Download and view the complete annual report
Please find page 37 of the 2012 CarMax annual report below. You can navigate through the pages in the report by either clicking on the pages listed below, or by using the keyword search tool below to find specific information within the annual report.-
 1
1 -
2
-
3
-
4
-
5
-
6
-
7
-
8
-
9
-
10
-
11
-
12
-
13
-
14
-
15
-
16
-
17
-
18
-
19
-
20
-
21
-
22
-
23
-
24
-
25
-
26
-
 27
27 -
 28
28 -
 29
29 -
 30
30 -
 31
31 -
 32
32 -
 33
33 -
 34
34 -
 35
35 -
 36
36 -
 37
37 -
 38
38 -
 39
39 -
 40
40 -
 41
41 -
 42
42 -
 43
43 -
 44
44 -
 45
45 -
 46
46 -
 47
47 -
48
-
49
-
50
-
51
-
52
-
53
-
54
-
55
-
56
-
57
-
58
-
59
-
60
-
61
-
62
-
63
-
64
-
65
-
66
-
67
-
68
-
69
-
70
-
71
-
72
-
73
-
74
-
75
-
76
-
77
-
78
-
79
-
80
-
81
-
82
-
83
-
84
-
85
-
86
-
87
-
88
-
89
-
90
-
91
-
92
 |
 |
31
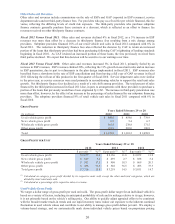
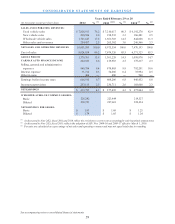
ALLOWANCE FOR LOAN LOSSES
(In millions) % (2) %
(2)
Balance as of beginning of year 38.9$ ʊ$
Impact of accounting change (1) ʊ 58.6
Balance after accounting change 38.9 0.9 58.6 1.4
Charge-offs (92.7) (85.9)
Recoveries 60.7 38.5
Provision for loan los ses 36.4 27.7
Balance as of end of year 43.3$ 0.9 38.9$ 0.9
Ye ar s Ende d Fe br uar y 2 9 or 2 8
2012 2011
(1) See Note 2(E) for additional information on the effects of the accounting change.
(2) Percent of total ending managed receivables as of the corresponding reporting date.
The allowance for loan losses represents an estimate of the amount of net losses inherent in our portfolio of managed
receivables as of the applicable reporting date and anticipated to occur during the following 12 months. The
allowance is primarily based on the credit quality of the underlying receivables, historical loss trends and forecasted
forward loss curves. We also take into account recent trends in delinquencies and losses, recovery rates and the
economic environment. The provision for loan losses is the periodic expense of maintaining an adequate allowance.
The allowance for loan losses was 0.9% of ending managed receivables as of both February 29, 2012, and
February 28, 2011, as favorable loss experience in the current year largely offset the cumulative effect of originating
an increased mix of loans with greater credit risk during fiscal 2012. We expect the allowance for loan losses as a
percentage of managed receivables will increase in future years as the higher credit risk loans become a larger
percentage of managed receivables.
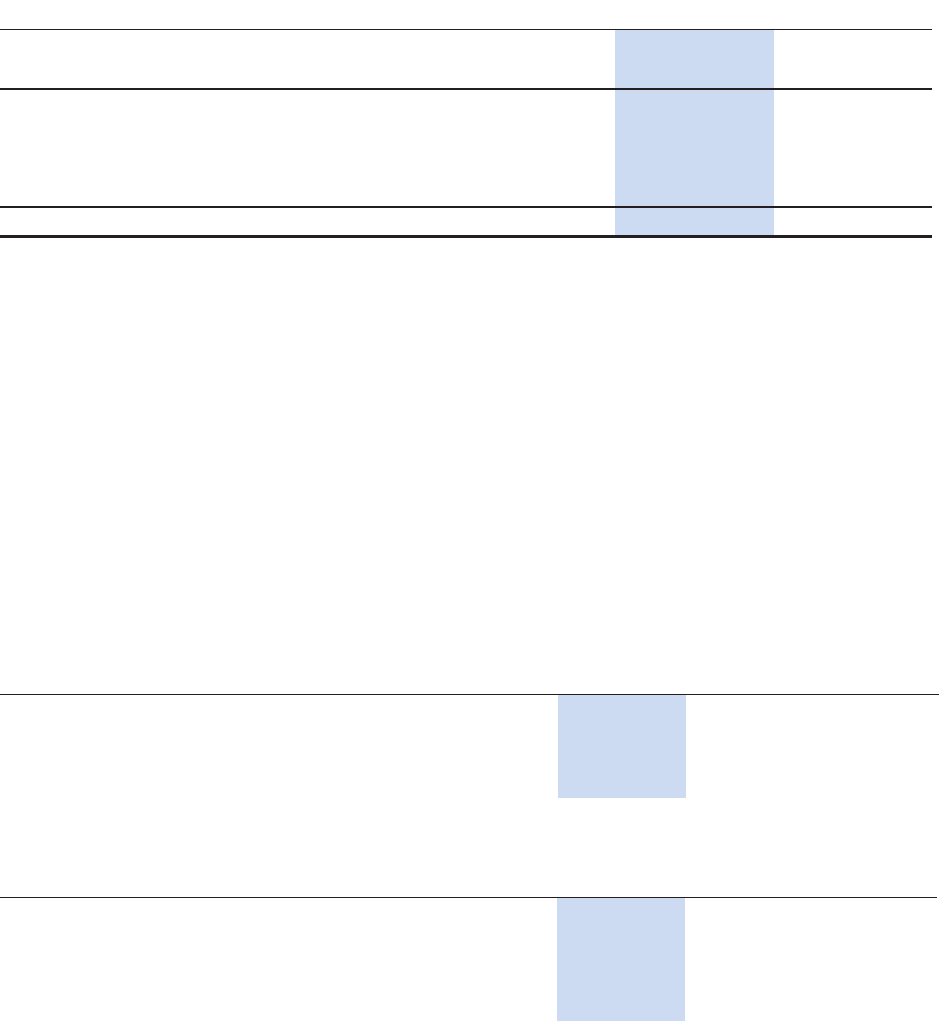
PAST DUE ACCOUNT INFORMATION
(In millions)
Accounts 31+ days pas t du e 116.5$ 121.3$ 133.2$
Ending managed receivables 4,981.8$ 4,334.6$ 4,112.7$
Past due accounts as a percentage of ending managed
receivables 2.34% 2.80% 3.24%
2011
As of February 29 or 28
2012 2010
CREDIT LOSS INFORMATION
(In m illions)
Net credit losses on managed receivables 32.0$ 47.5$ 70.1$
Total average managed receivables 4,662.4$ 4,229.9$ 4,057.2$
Net credit losses as a percentage of total
average managed receivables 0.69% 1.12% 1.73%
Average recovery rate 59.7% 54.8% 49.8%
2010
Year s Ende d Fe br uar y 2 9 or 2 8
2012 2011
In fiscal 2012, we experienced improvements in both past due accounts as a percentage of ending managed
receivables and net credit losses as a percentage of total average managed receivables. We believe the
improvements were the result of several factors including our credit tightening implemented in fiscal 2010, the
strong recovery rates and general industry trends for losses and delinquencies.
The average recovery rate represents the average percentage of the outstanding principal balance we receive when a
vehicle is repossessed and liquidated at wholesale auction. The annual recovery rate has ranged from a low of 42%
to a high of 60%, and it is primarily affected by changes in the wholesale market pricing environment.