CarMax 2012 Annual Report Download - page 34
Download and view the complete annual report
Please find page 34 of the 2012 CarMax annual report below. You can navigate through the pages in the report by either clicking on the pages listed below, or by using the keyword search tool below to find specific information within the annual report.-
 1
1 -
2
-
3
-
4
-
5
-
6
-
7
-
8
-
9
-
10
-
11
-
12
-
13
-
14
-
15
-
16
-
17
-
18
-
19
-
20
-
21
-
22
-
23
-
 24
24 -
 25
25 -
 26
26 -
 27
27 -
 28
28 -
 29
29 -
 30
30 -
 31
31 -
 32
32 -
 33
33 -
 34
34 -
 35
35 -
 36
36 -
 37
37 -
 38
38 -
 39
39 -
 40
40 -
 41
41 -
 42
42 -
 43
43 -
 44
44 -
45
-
46
-
47
-
48
-
49
-
50
-
51
-
52
-
53
-
54
-
55
-
56
-
57
-
58
-
59
-
60
-
61
-
62
-
63
-
64
-
65
-
66
-
67
-
68
-
69
-
70
-
71
-
72
-
73
-
74
-
75
-
76
-
77
-
78
-
79
-
80
-
81
-
82
-
83
-
84
-
85
-
86
-
87
-
88
-
89
-
90
-
91
-
92
 |
 |
28
Fiscal 2011 Versus Fiscal 2010. Our wholesale vehicle gross profit increased $67.3 million, or 39%, to
$238.8 million from $171.5 million in fiscal 2010. The improvement reflected the 33% increase in wholesale unit
sales combined with a 4% rise in wholesale vehicle gross profit per unit. Wholesale vehicle gross profit per unit
increased $39 to $908 per unit from $869 per unit in fiscal 2010. The strength of our wholesale gross profit per unit
reflected the strong demand for older, higher mileage vehicles, which are the mainstay of our auctions, as well as the
continued strong dealer attendance and resulting high dealer-to-car ratios at our auctions.
Other Gross Profit
Other gross profit includes profits related to ESP and GAP revenues, net third-party finance fees and the service
department. We have no cost of sales related to ESP and GAP revenues or net third-party finance fees, as these
represent commissions paid to us by certain third-party providers, net of the discount associated with the loans
purchased by subprime providers. Accordingly, changes in the relative mix of the other gross profit components can
affect the composition of other gross profit.
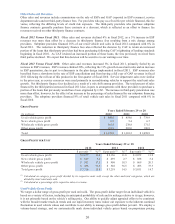
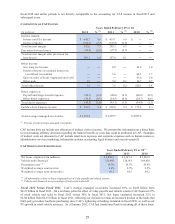
Fiscal 2012 Versus Fiscal 2011. Other gross profit fell $21.0 million, or 10%, to $181.9 million from
$203.0 million in fiscal 2011, as the 3% growth in ESP profits was more than offset by lower third-party finance
fees and service department profits. The $14.6 million reduction in third-party finance fees reflected the mix shift
among providers and the resulting increase in the share of finance contracts purchased by subprime providers, as
well as CAF’s retention of loans that previously had been financed by third-party providers. Service department
gross profit declined $12.2 million primarily due to the deleverage associated with increased service overhead costs,
the modest retail unit sales growth and lower service retail sales.
Fiscal 2011 Versus Fiscal 2010. Other gross profit increased $22.1 million, or 12%, to $203.0 million from
$180.8 million in fiscal 2010. ESP and GAP gross profit increased $29.3 million, or 20%, benefiting from the 11%
increase in used unit sales, the improved ESP penetration rate and the prior year roll out of the GAP product.
Service department gross profit grew $2.9 million, or 8%. The increases in ESP and GAP and service department
gross profits were partially offset by a $10.1 million reduction in net third-party finance fees, which were adversely
affected by the mix shift among providers.
Impact of Inflation
Historically, inflation has not been a significant contributor to results. Profitability is primarily affected by our
ability to achieve targeted unit sales and gross profit dollars per vehicle rather than by changes in average retail
prices. However, increases in average vehicle selling prices benefit the SG&A ratio and CAF income, to the extent
the average amount financed also increases.
During the last three fiscal years, we experienced a period of appreciation in used vehicle wholesale pricing. We
believe the appreciation resulted, in part, from the reduced supply of late-model used vehicles in the market that was
caused by the dramatic decline in new car industry sales and the associated slow down in used vehicle trade-in
activity, compared with pre-recession periods. The higher wholesale values increased both our vehicle acquisition
costs and our average selling prices for used and wholesale vehicles. In fiscal 2012, we also experienced
inflationary increases in key reconditioning cost components including tires and petroleum-based products.
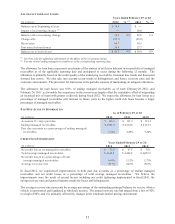
CarMax Auto Finance Income
CAF provides financing for a portion of our used and new car retail sales. Because the purchase of a vehicle is
generally reliant on the consumer’s ability to obtain on-the-spot financing, it is important to our business that
financing be available to creditworthy customers. While financing can also be obtained from third-party sources, we
believe that total reliance on third parties can create unacceptable volatility and business risk. Furthermore, we
believe that our processes and systems, the transparency of our pricing and our vehicle quality provide a unique and
ideal environment in which to procure high quality auto loans, both for CAF and for the third-party financing
providers. Generally, CAF has provided us the opportunity to capture additional profits and cash flows from auto
loan receivables while managing our reliance on third-party financing sources. We also believe CAF enables us to
capture additional sales.
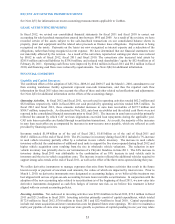
CAF provides financing for qualified customers at competitive market rates of interest. CAF income primarily
reflects the interest and fee income generated by the auto loan receivables less the interest expense associated with
the debt issued to fund these receivables, direct CAF expenses and a provision for estimated loan losses.
As described in the Critical Accounting Policies section of this MD&A, as of March 1, 2010, we adopted ASU Nos.
2009-16 and 2009-17 on a prospective basis. As a result, the basis on which CAF income was recognized in